Data Analysis Toolpak

Web Demo
No installation or Excel account required. Explore the pre-configured interactive model directly in your browser:
Data Analysis Toolpak adds the STAT custom function namespace to Excel. It provides Python-backed statistical calculations for probability distributions, descriptive statistics, hypothesis tests, correlation and association testing, regression models, Bayesian analysis, multivariate analysis, survival models, and time-series workflows.
The add-in is designed for spreadsheet-first analysis: keep observations in Excel ranges, call calculations with formulas such as =STAT.DESCRIBE(A2:A101), and use the taskpane when you want guided function discovery, parameter entry, or a static result instead of a live formula.
Warning: Functions are provided as-is for academic and non-commercial use with no warranty whatsoever as per the terms of use. Never rely on results for clinical, financial, safety, compliance, or commercial decisions. Always verify assumptions, inputs, methods, and results independently.
Quick Start
- Install Data Analysis Toolpak using your organization's add-in deployment process or a sideloaded manifest, then open Excel.
- On the Home ribbon, choose Data Analysis Toolpak to open the taskpane.
- Search or browse functions, select a function, fill the required parameters, and insert either a formula or the calculated result.
- To type formulas manually, use the
STATnamespace:=STAT.FUNCTION_NAME(argument1, argument2, ...).
Use Formulas Directly
Enter functions in cells with the STAT namespace. For example:
=STAT.NORM(1.96, 0, 1, "cdf")
Use normal Excel cell references and ranges for parameters. Table-like parameters use Excel ranges such as A2:C25, which are passed to Python internally as two-dimensional lists. Many functions return scalar values. Functions that produce multiple statistics, model summaries, or tables may spill into adjacent cells or return a structured result, depending on the underlying Python function.
Insert From The Taskpane
Use the taskpane when you want to search the function catalog, inspect parameter descriptions, choose option values, or select worksheet ranges through the UI. The taskpane can insert a live custom function formula or calculate the current result and write the static value into the selected cell.
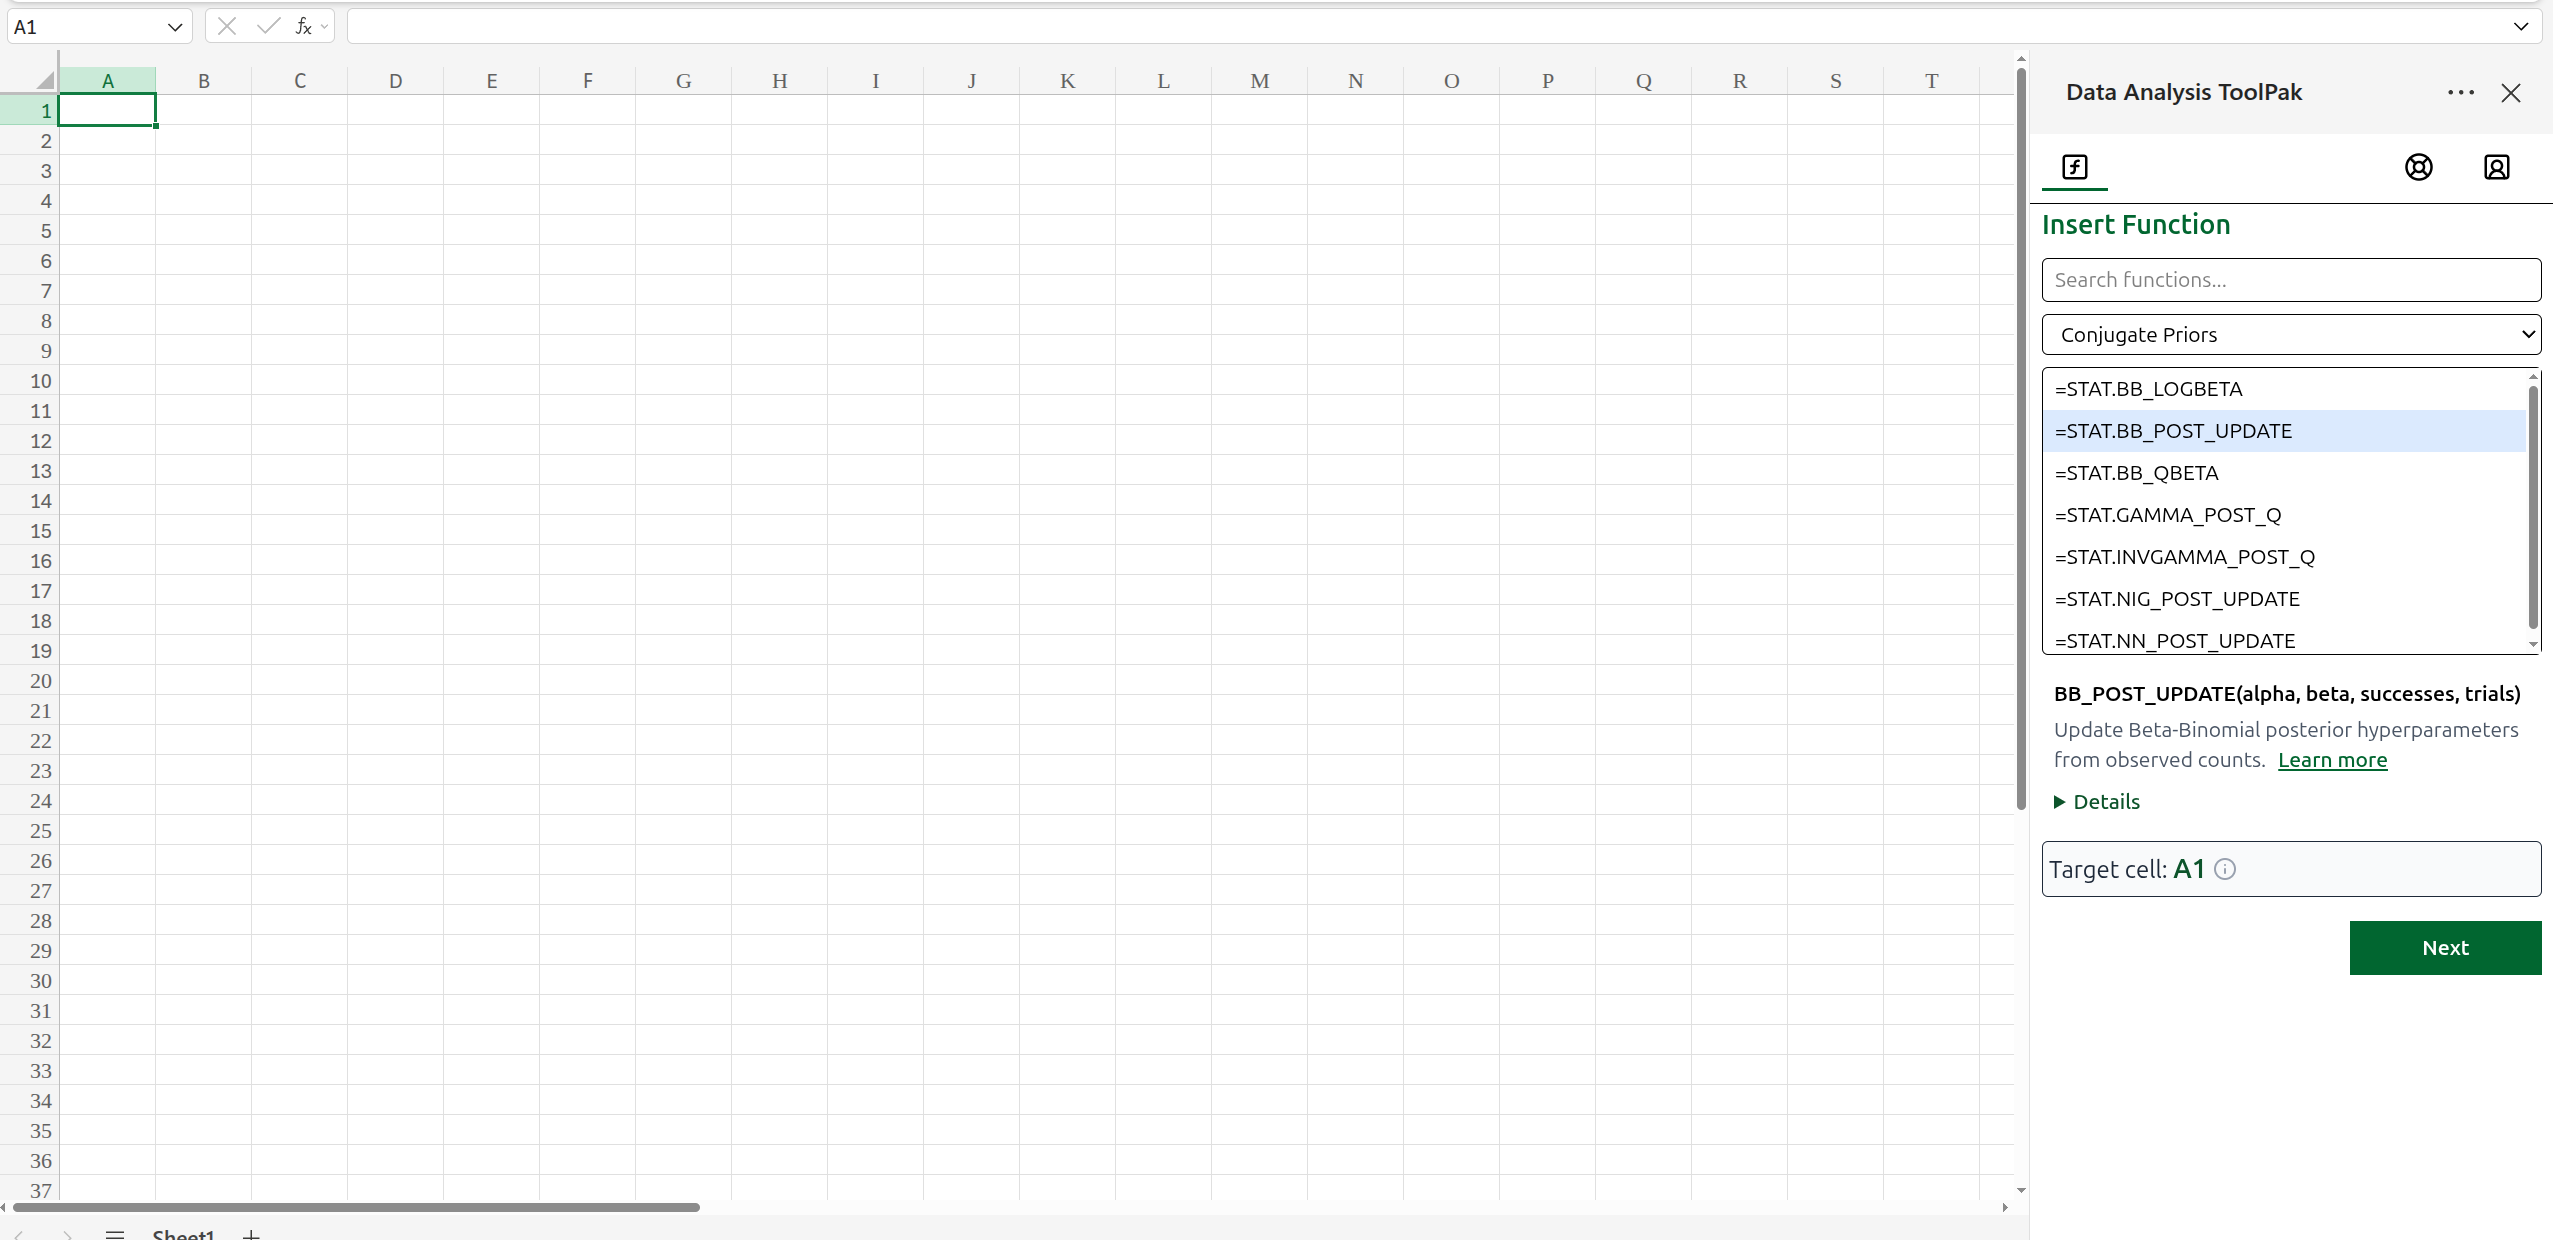 Figure 1: Use the taskpane to search and browse the statistical function catalog.
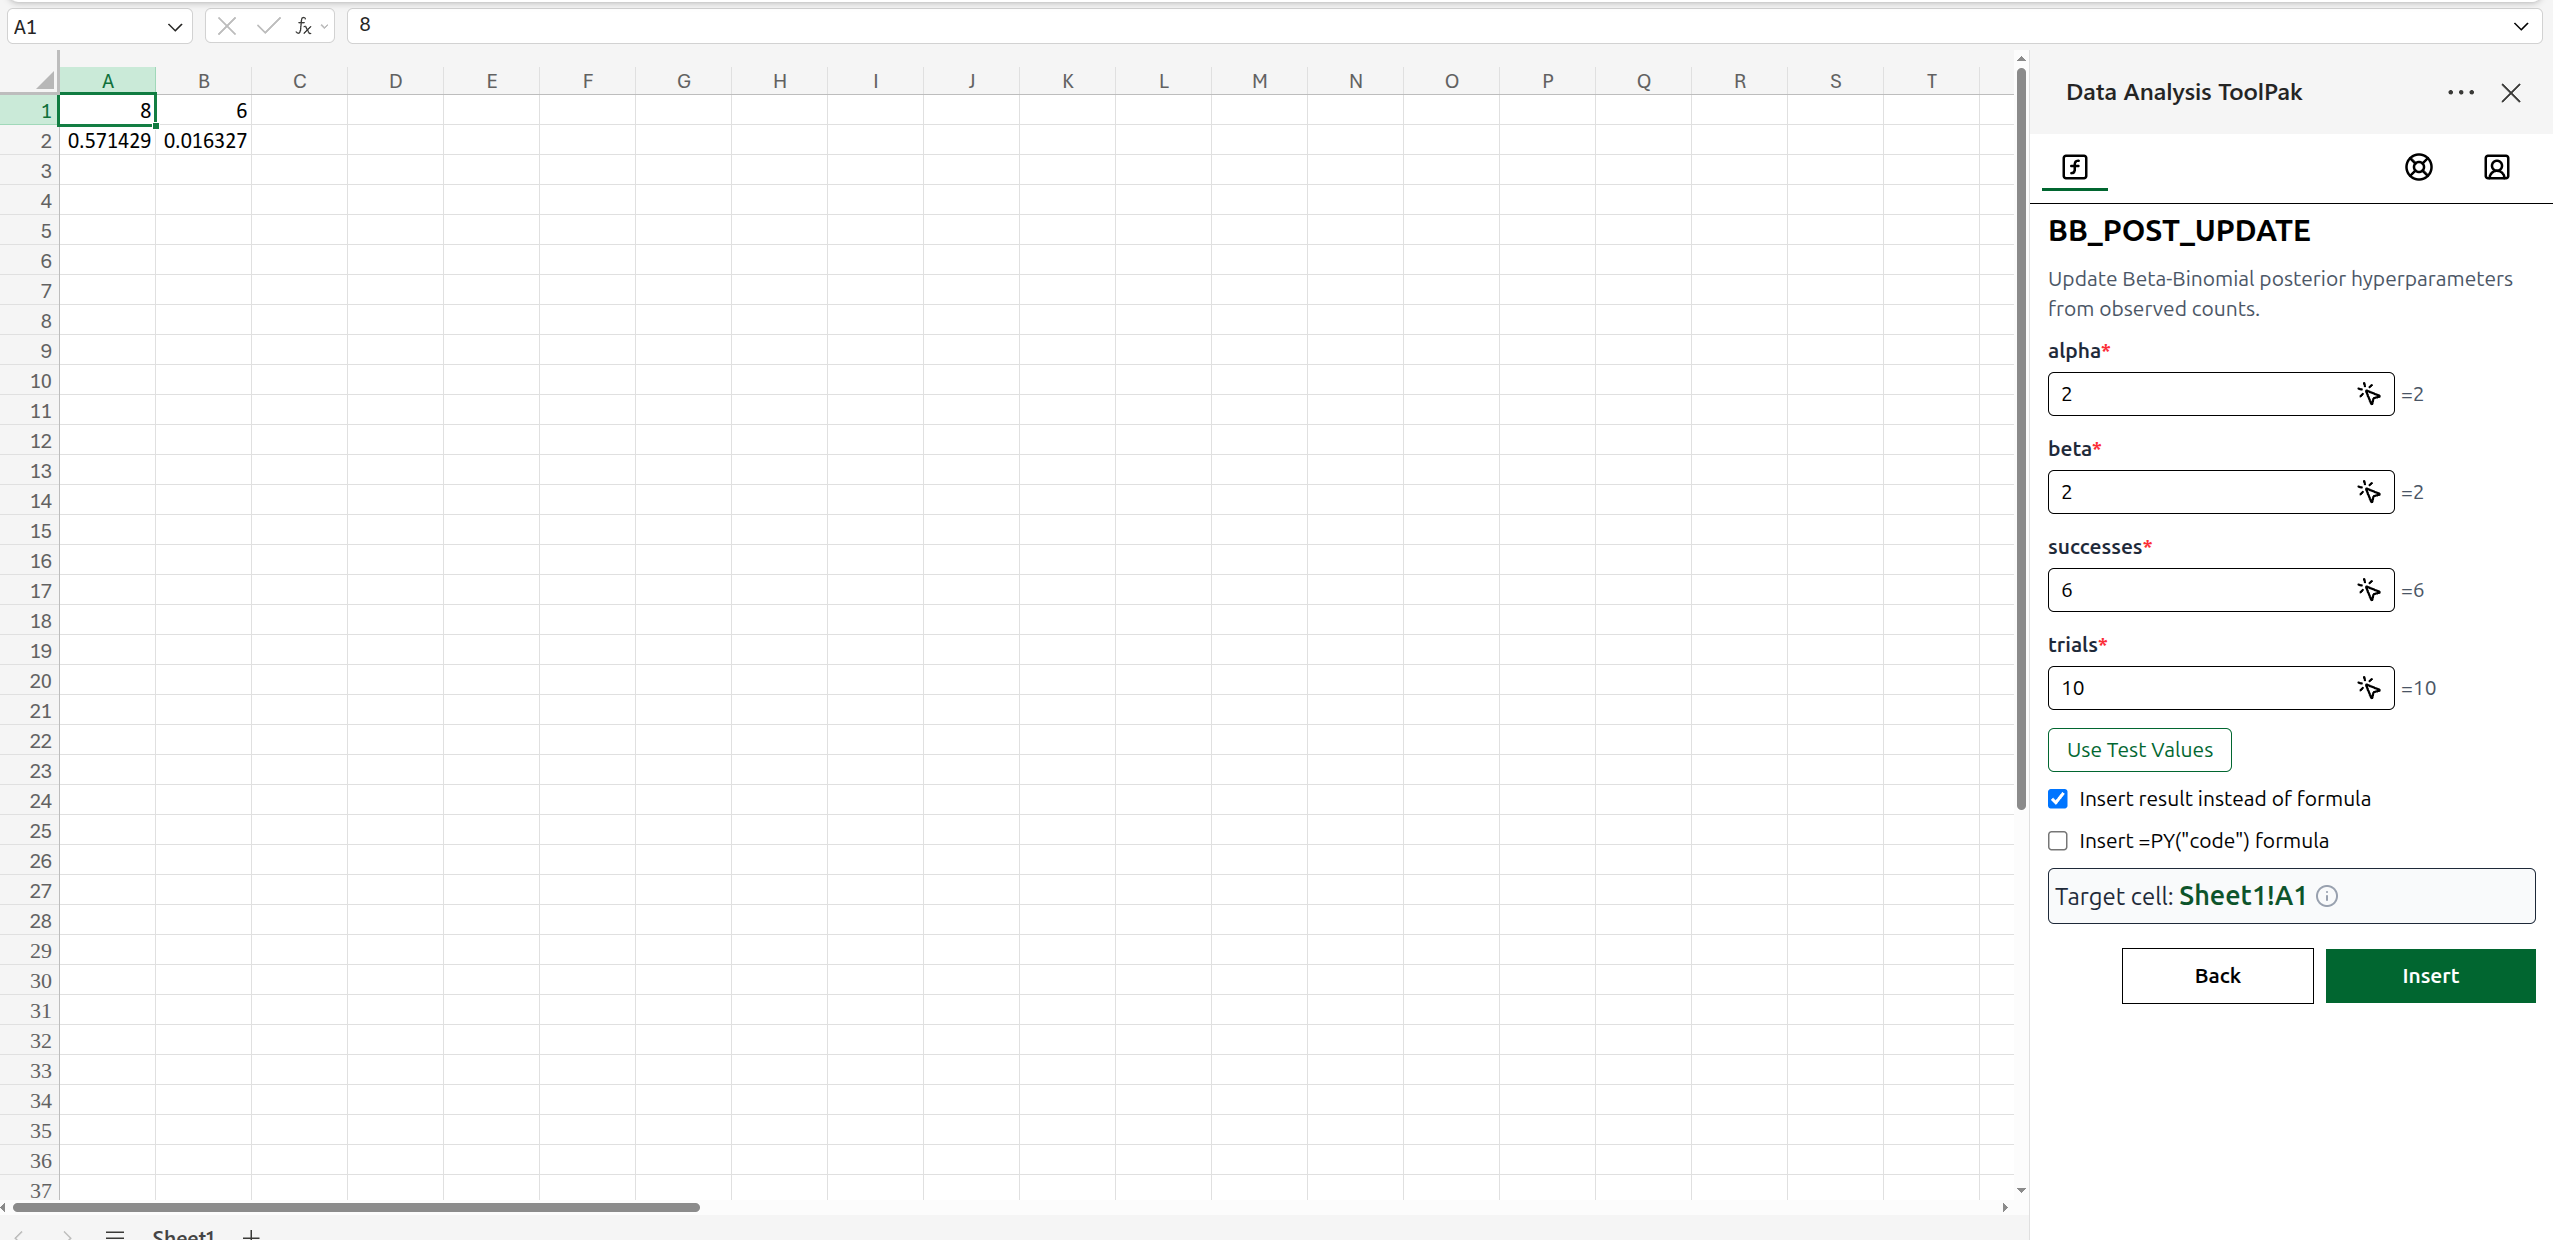 Figure 2: Fill parameters and choose to insert a live formula or a static result.
Some functions support insertion as Excel's native =PY(...) formula. Use this path when the taskpane offers it and you want the workbook to use Microsoft Python in Excel rather than the add-in's local Pyodide runtime. The Function Reference table marks native =PY(...) support per function from the add-in metadata.
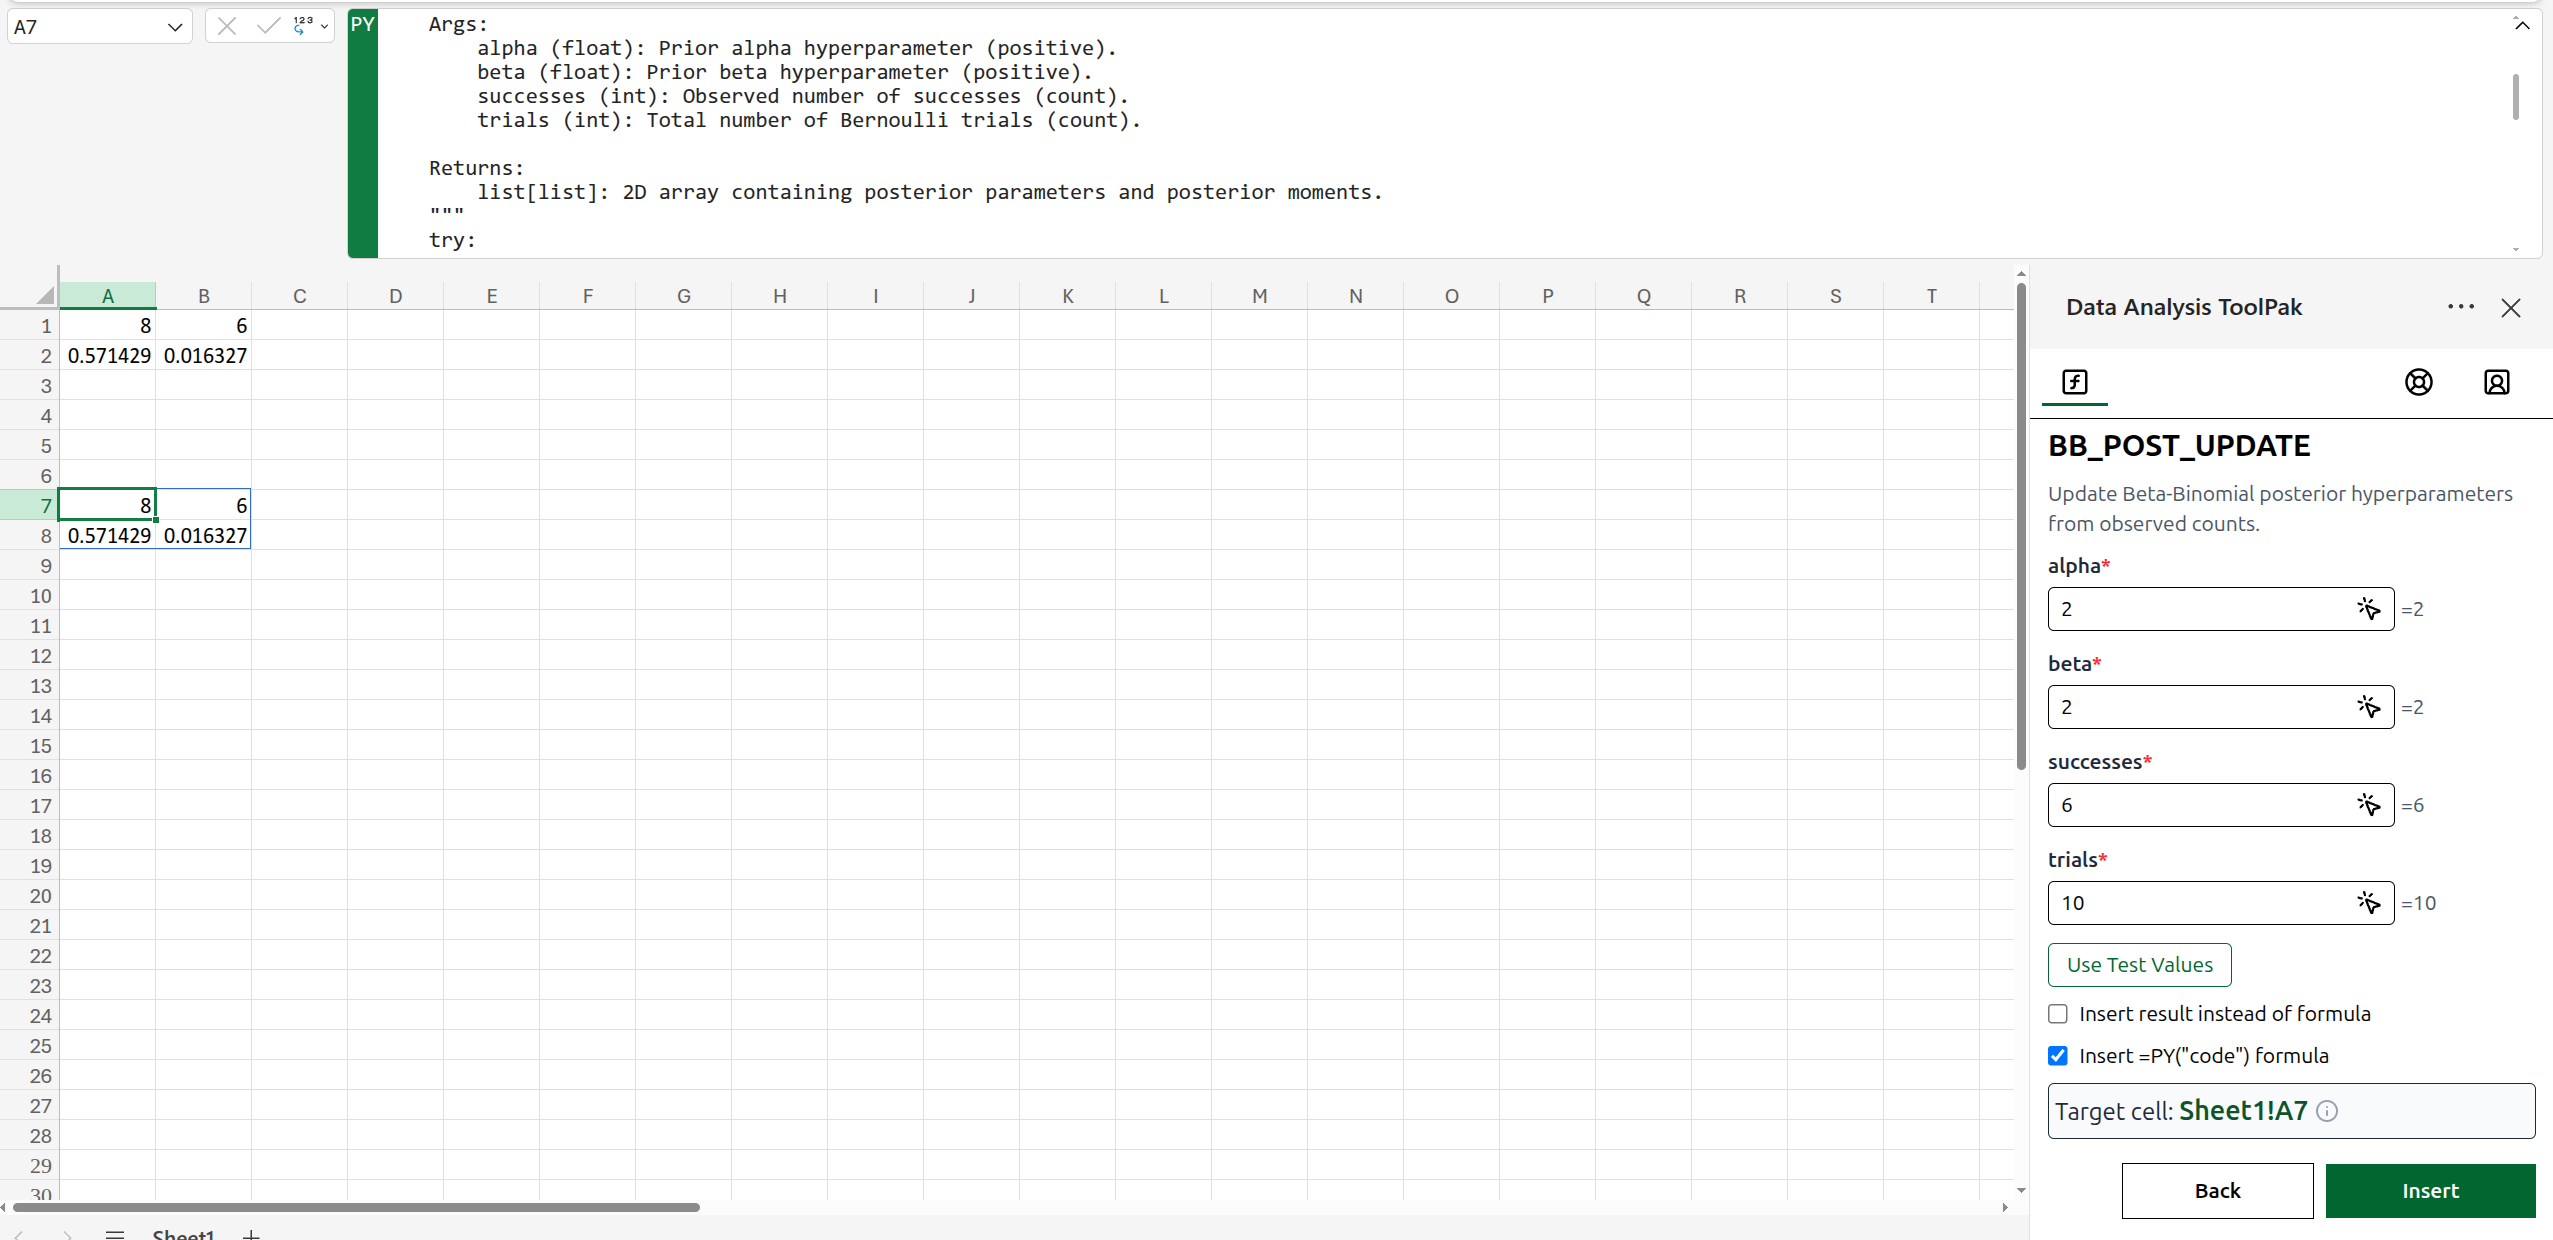 Figure 3: Some functions support direct insertion as a native Excel =PY formula.
Function Areas
Data Analysis Toolpak includes Python-backed functions across these statistical areas. Use the taskpane search box to find the specific calculation, inspect parameter descriptions, and open detailed function documentation when available.
| Area | What it covers |
|---|---|
| Probability distributions | Continuous, discrete, and multivariate distributions, including normal, t, chi-square, F, beta, binomial, Poisson, gamma, lognormal, multinomial, Dirichlet, Wishart, and related distribution methods. |
| Summary and frequency statistics | Descriptive statistics, geometric and harmonic means, moments, skewness, kurtosis, modes, percentiles, frequency tables, binned statistics, and reliability metrics. |
| Hypothesis tests | One-sample, paired-sample, independent-sample, association, correlation, normality, variance, goodness-of-fit, ANOVA, and post-hoc testing workflows. |
| Regression and statistical models | OLS, WLS, GLS, robust regression, quantile regression, GLM, count models, discrete choice models, mixed effects, survival models, and diagnostics. |
| Bayesian analysis | Conjugate-prior updates, credible intervals, posterior summaries, Dirichlet-multinomial calculations, tail probabilities, and weighted posterior summaries. |
| Multivariate analysis | MANOVA, canonical correlation, factor analysis, PCA, multidimensional scaling, random correlation matrices, and multivariate distribution helpers. |
| Time series | Autocorrelation, stationarity tests, moving averages, decomposition, spectral analysis, exponential smoothing, ARIMA/SARIMAX forecasts, and order selection. |
Common Use Cases
1. Descriptive Statistics For A Metric
Problem: You have a column of sales, response times, or measurements and need a quick statistical profile.
Formula: =STAT.DESCRIBE(A2:A9)
Use when: You want count, central tendency, spread, and shape statistics from one range before moving into charts, tests, or models.
| Row | Value | Formula or action | Output |
|---|---|---|---|
| 2 | 12.4 | Select A2:A9 in the taskpane for STAT.DESCRIBE | Count, min, max, mean, variance, skewness, kurtosis |
| 3 | 10.9 | Or type =STAT.DESCRIBE(A2:A9) | Same spilled summary output |
| 4 | 14.8 | Leave ddof blank for the default degrees-of-freedom behavior | Uses metadata default ddof=0 |
| 5 | 13.2 | Set bias if you need biased or unbiased shape estimates | Adjusted shape statistics |
2. Compare Two Independent Groups
Problem: You ran an A/B test and need to know whether the average metric differs between two independent groups.
Formula: =STAT.TTEST_IND(A2:A8, B2:B8, FALSE, "two-sided")
Use when: You have two independent samples and want a t-test. Set equal_var to FALSE for Welch's t-test when variances may differ.
| Observation | Variant A | Variant B | Formula or action | Output |
|---|---|---|---|---|
| 1 | 18.2 | 20.1 | Select A2:A8 as a, B2:B8 as b | Test statistic and p-value |
| 2 | 17.9 | 22.4 | Set equal_var to FALSE | Welch-style comparison |
| 3 | 19.1 | 21.8 | Set ttest_alternative to two-sided | Two-sided significance test |
| 4 | 18.7 | 20.9 | Insert formula for live recalculation | Updates when new observations arrive |
3. Probability Distribution Lookup
Problem: You need the probability that a standard normal variable is less than or equal to 1.96.
Formula: =STAT.NORM(1.96, 0, 1, "cdf")
Use when: You need distribution values such as probability density, cumulative probability, inverse CDF, survival probability, mean, variance, standard deviation, or median. Most distribution wrappers use a method parameter such as norm_method, binom_mode, or poisson_mode.
| Case | Value | Parameters | Formula or action | Output |
|---|---|---|---|---|
| Standard normal CDF | 1.96 | loc=0, scale=1, norm_method="cdf" | =STAT.NORM(1.96,0,1,"cdf") | About 0.975 |
| Normal PDF | 0 | loc=0, scale=1, norm_method="pdf" | =STAT.NORM(0,0,1,"pdf") | About 0.399 |
| Poisson probability | 3 | mu=2.5, poisson_mode="pmf" | =STAT.POISSON_DIST(3,2.5,"pmf") | Probability of exactly 3 events |
| Binomial probability | 7 | n=10, p=0.6, binom_mode="pmf" | =STAT.BINOM(7,10,0.6,"pmf") | Probability of 7 successes |
4. Regression Model From Worksheet Ranges
Problem: You have a response column and one or more predictor columns and want an ordinary least squares model summary.
Formula: =STAT.OLS_REGRESSION(D2:D21, A2:C21)
Use when: You need a model estimate and diagnostics from tabular data already in Excel. Keep y as a single response column and x as one or more predictor columns with matching row counts.
| Row | Predictor 1 | Predictor 2 | Response | Formula or action | Output |
|---|---|---|---|---|---|
| 2 | 4.1 | 7.2 | 32.5 | Select D2:D21 as y and A2:C21 as x | Regression coefficients and model statistics |
| 3 | 5.0 | 8.1 | 36.0 | Leave fit_intercept blank to use the default | Includes an intercept by default |
| 4 | 5.8 | 7.9 | 38.4 | Set alpha if you need a different confidence level | Confidence intervals adjust |
| 5 | 6.2 | 9.4 | 43.1 | Insert result instead of formula for a frozen report table | Static model summary |
5. Time-Series Stationarity And Forecasting
Problem: You have monthly demand data and need to check stationarity before forecasting.
Formula: =STAT.ADFULLER(B2:B61)
Use when: You want to diagnose a series before selecting a model. Pair stationarity diagnostics such as ADFULLER or KPSS with forecasting helpers such as SES_FORECAST, HOLT_FORECAST, HW_FORECAST, ARIMA_FORECAST, or SARIMAX_FORECAST.
| Month | Demand | Formula or action | Output |
|---|---|---|---|
| Jan | 120 | =STAT.ADFULLER(B2:B61) | ADF statistic, p-value, and related diagnostics |
| Feb | 128 | =STAT.KPSS(B2:B61) | KPSS statistic, p-value, lags, and critical values |
| Mar | 131 | =STAT.HW_FORECAST(B2:B61,6,"add","add",12) | Six-step seasonal forecast |
| Apr | 125 | Insert a static result after finalizing assumptions | Stable forecast output for a report |
6. Troubleshooting Optional Parameters And Table Shapes
Problem: A formula returns an error string, #VALUE!, or output that does not match expectations.
Formula/action: Reopen the function in the taskpane, check required parameters, inspect option names, and verify each range shape.
Use when: A model, test, or distribution wrapper expects a specific table layout, enum value, or non-empty numeric range.
| Symptom | Likely cause | Formula or action | Output |
|---|---|---|---|
Error: ... | Invalid option text such as a misspelled method value | Choose the value from the taskpane dropdown or type the documented option exactly | Function recalculates |
#VALUE! | Input range is empty, ragged, or has unexpected text | Confirm ranges are rectangular and numeric where required | Valid range passed to Python |
| Model returns an error string | Response and predictor ranges have different row counts | Align y, x, and group ranges before rerunning | Model summary output |
| Result changes too slowly | Large model or first Python runtime load | Insert static result after checking the output | Stable worksheet value |
Input And Output Notes
- Numeric parameters use workbook numbers. Units are not converted automatically.
- Range parameters with type
list[list]should be rectangular Excel ranges. A single row or single column is still passed as a two-dimensional list. - Optional parameters are shown in square brackets in signatures. Defaults are shown in the Function Reference table and in the taskpane metadata.
- Boolean parameters accept Excel TRUE/FALSE values or taskpane controls where available.
- For option parameters, choose the value from the taskpane dropdown or type the documented option text exactly as shown.
- Functions built on SciPy, statsmodels, Pingouin, scikit-learn, lifelines, or related Python packages inherit the assumptions and limitations of those libraries.
- Functions execute through the local Pyodide runtime unless inserted through Excel's native
=PY(...)path.
FAQ
Does Data Analysis Toolpak send workbook data to Boardflare?
No. Data Analysis Toolpak calculations run inside Excel using a local Python/Pyodide runtime, and supported calculations can also be inserted as native Excel =PY(...) formulas. Review your organization's Microsoft 365 Python in Excel policy before using the native =PY(...) path.
Why does the first calculation take longer?
The add-in may need to initialize the Python runtime and load packages such as SciPy, statsmodels, Pingouin, scikit-learn, or lifelines the first time a function is used. Later calculations are usually faster once the runtime is warm.
Why do some functions not support native =PY insertion?
Native =PY(...) support is controlled by whether Python in Excel supports the required packages or modules in its execution environment.
What should I do with high-stakes analyses?
DO NOT RELY ON DATA ANALYSIS TOOLPAK FOR HIGH-STAKES ANALYSES. Use it for exploratory, educational, or non-commercial workbook analysis only.
Each function has a link to its Python source code or detailed documentation where available, and users are encouraged to review that source before relying on the result, even for non-critical calculations. Since Data Analysis Toolpak functions wrap established Python packages, it is important to validate the relevant source code, documentation, assumptions, and limitations of the underlying package being called. Neither the wrapper functions nor the underlying Python libraries have been validated for accuracy, reliability, or fitness for any purpose. They are provided "as is" with no warranties of any kind. Wrapper code and underlying Python libraries may be updated, changed, or removed at any time without notice. Use of this add-in is solely at the user's own risk.