Revenue Operations Command Center
Use Excel as the durable sales-pipeline model and marimo as the interactive application layer. This template deliberately exercises a broad set of built-in marimo UI components while keeping the workbook useful on its own.
Result preview
The supplied pipeline contains 15 opportunities worth $2.024M. Current probability weighting produces $1.174M of weighted pipeline. Within the worksheet’s 90-day horizon, the baseline forecast is $984.9K; applying the durable +5 percentage-point win-rate uplift and 3% scenario discount produces a $1.035M scenario forecast, or about 115% of the $900K target.
What this template does
- Reads a durable opportunity table from Excel with region, segment, owner, stage, deal size, probability, and days to close.
- Publishes an executive summary, stage funnel, and top weighted opportunities back into green worksheet output areas.
- Adds a marimo sidebar with multi-select filters, range sliders, scenario sliders, a radio mode selector, a switch, live statistics, and explanatory accordion content.
- Organizes the application into Overview, Pipeline explorer, Scenario lab, and Data & model tabs, with a nested chart switcher on the overview.
- Provides a selectable marimo table with deal-level detail, a dataframe explorer, KPI cards, callouts, and reactive Matplotlib charts.
- Keeps sidebar exploration transient so workbook cells remain the durable, auditable model state.
Why Python
The expected-value arithmetic is simple; the application behavior is not. Python makes it practical to validate mixed Excel inputs once, derive a coherent analytical DataFrame, and reuse that state across filtering, scenario planning, visualizations, detailed tables, and worksheet publications. Marimo’s reactive dataflow then keeps the UI synchronized without callback-heavy application code.
Try it live
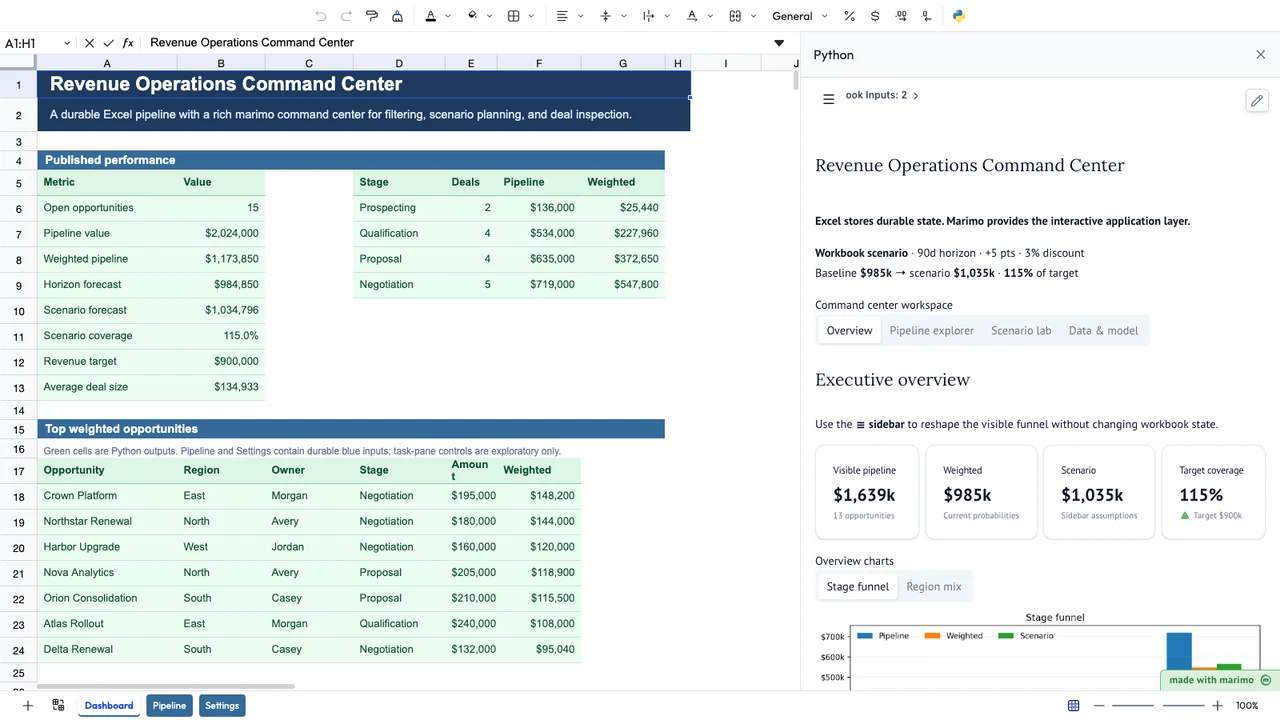
Use the sidebar to filter by region/stage/segment, narrow probability and deal-size ranges, change the close horizon, and test exploratory win-rate/discount assumptions. Those controls deliberately do not overwrite the workbook. To change the durable published scenario, edit the blue values on the Settings sheet.
Operating workflow
Author: a revenue-operations analyst maintains the pipeline schema, validation rules, scenario logic, UI composition, and worksheet publications.
Workbook user: a sales leader or finance partner updates opportunities and durable assumptions in Excel, then uses the task-pane command center for exploration and review.
App mode can make the notebook feel more like an application for workbook users, but it changes presentation rather than permissions, source access, or workbook trust.
Download the Excel template
Inputs and assumptions
| Input | Location | Default |
|---|---|---|
| Opportunity table | Pipeline!A5:H20 |
15 opportunities |
| Revenue target | Settings!B6 |
$900,000 |
| Forecast horizon | Settings!B7 |
90 days |
| Win-rate uplift | Settings!B8 |
5 percentage points |
| Scenario discount | Settings!B9 |
3% |
Probability must remain between 0% and 100%, deal amount and days to close must be non-negative, and the target must be positive. The durable scenario caps uplifted probability at 100% before applying the discount.
Notebook implementation
The workbook binding is intentionally small; the richer application is derived from one validated DataFrame.
inputs = bf.inputs(
    pipeline=bf.ref("Pipeline!A5:H20", headers=True),
    controls=bf.ref("Settings!A5:B9", headers=True),
)

search_filter = mo.ui.text(...)
regions_filter = mo.ui.multiselect(...)
probability_filter = mo.ui.range_slider(...)
uplift_slider = mo.ui.slider(...)

sidebar = mo.sidebar([...])
workspace_tabs = mo.ui.tabs({
    "Overview": overview,
    "Pipeline explorer": pipeline_explorer,
    "Scenario lab": scenario_lab,
    "Data & model": data_method,
})

publication = bf.publish(
    outputs={
        "summary": summary,
        "stage_summary": stage_summary,
        "top_deals": top_deals,
    }
)
How the calculation/model works
For each opportunity, weighted value is Amount × Probability. The durable horizon forecast sums weighted value only for deals whose Days to close is within the worksheet horizon. The durable scenario adds the worksheet uplift to each eligible probability, clips it to 100%, multiplies by 1 - discount, and compares the result with the revenue target.
The sidebar uses the same row-level data for transient exploration, including a text search across opportunity, owner, region, segment, and stage. It can filter the population, modify the visible close horizon, apply an exploratory probability uplift and discount, or switch from expected-value weighting to a simple committed-only rule where probabilities at or above 70% count fully and lower probabilities count as zero.
Validation / expected results
| Check | Expected value |
|---|---|
| Open opportunities | 15 |
| Pipeline value | $2,024,000 |
| Weighted pipeline | $1,173,850 |
| 90-day horizon forecast | $984,850 |
| Durable scenario forecast | $1,034,796 |
| Scenario target coverage | 114.98% |
Validation scenarios also verify a higher revenue target, a 120-day horizon, a larger win-rate uplift, a 35% durable discount that expands the exploratory slider range, and a deal-amount edit above the default $250K filter ceiling.
Limitations
This is a deterministic expected-value model, not a probabilistic bookings forecast. It does not estimate stage-transition timing, deal slippage, rep capacity, seasonality, correlations between opportunities, or probability calibration. The committed-only mode is intentionally simple and should not be interpreted as a statistical forecast.
When to use this approach
Use it when the workbook should remain the auditable system of record but users benefit from a richer analytical workspace than the grid alone can provide. The architecture is especially useful for internal planning tools where one analyst authors the model and many workbook users need filters, diagnostics, scenarios, and drill-down interactions without maintaining Python code.