Friction
Overview
Friction in fluid flow refers to the resistance encountered as fluid moves through pipes, ducts, and equipment. This resistance manifests as pressure drop, which must be overcome by pumps or compressors to maintain flow. Understanding and accurately predicting friction is essential for designing efficient piping systems, sizing pumps and compressors, and minimizing energy consumption in industrial processes ranging from water distribution networks to petrochemical plants.
The fundamental relationship governing friction in pipe flow is the Darcy-Weisbach equation, which relates pressure drop to the Darcy friction factor (a dimensionless parameter also called the Moody friction factor). This friction factor characterizes the energy dissipation per unit length of pipe and depends primarily on two factors: the Reynolds number (which indicates whether flow is laminar or turbulent) and the relative roughness of the pipe wall (the ratio of surface roughness height to pipe diameter, ε/D).
Flow Regimes and the Friction Factor: In laminar flow (Re < 2300), viscous forces dominate and the friction factor follows the simple analytical relationship f = 64/Re. The FRICTION_LAMINAR tool implements this exact solution. As Reynolds number increases beyond Re ≈ 2300, flow enters a transitional regime where it fluctuates between laminar and turbulent states before becoming fully turbulent around Re ≈ 4000. In turbulent flow, the friction factor depends on both Reynolds number and relative roughness, requiring more complex correlations.
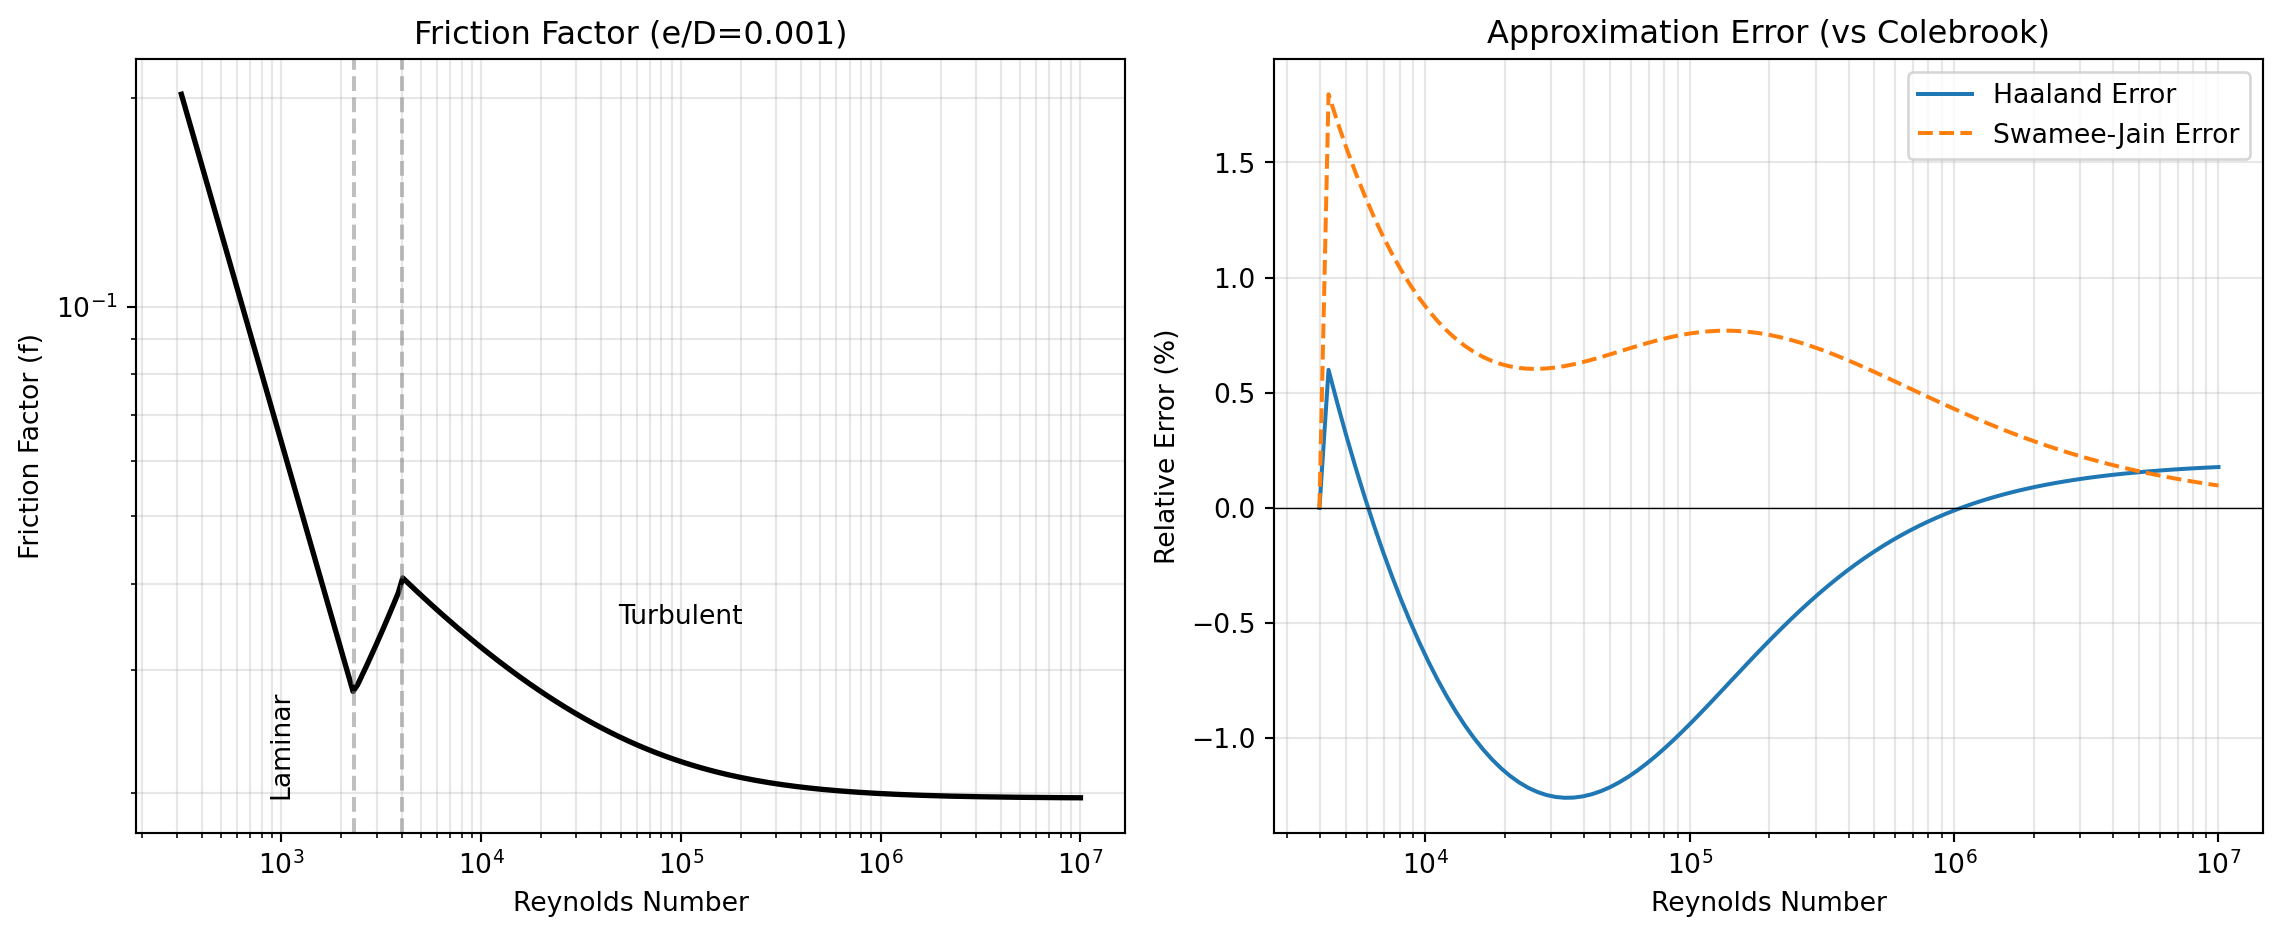
The Colebrook Equation: For turbulent flow in rough pipes, the implicit Colebrook equation is considered the reference standard. However, because it requires iterative solution, numerous explicit approximations have been developed for engineering calculations. The COLEBROOK tool provides the exact iterative solution, while HAALAND, SWAMEE_JAIN, and MOODY offer explicit approximations with varying accuracy and computational simplicity. For high-precision applications, CLAMOND provides a solution accurate to nearly machine precision. The figure below (Figure 1) illustrates how friction factor varies with Reynolds number and compares the relative error of common explicit approximations.
Specialized Correlations: Different flow geometries and conditions require specialized treatments. The BLASIUS correlation applies specifically to turbulent flow in smooth pipes (where roughness effects are negligible). The CHURCHILL equation provides a universal formulation valid across all flow regimes, from laminar through transitional to fully turbulent, making it useful when flow regime is uncertain. For curved pipes and helical coils, secondary flow effects alter the friction characteristics; FF_CURVED and HELICAL_RE_CRIT handle these geometries. Plate heat exchangers with chevron-style corrugations have unique friction characteristics addressed by FP_MARTIN and FP_MULEY_MANGLIK.
Practical Pressure Drop Calculations: The friction factor is typically used to calculate actual pressure drop in piping systems. ONE_PHASE_DP applies the Darcy-Weisbach equation to compute frictional pressure loss, while DP_GRAV calculates the gravitational component for inclined pipes. For fully turbulent flow in commercial pipe, FT_CRANE implements the simplified Crane correlation. The VON_KARMAN equation provides the limiting friction factor for rough pipes at infinite Reynolds number. For compressible gas flow in pipelines, the TRANS_FACTOR tool converts between Darcy friction factor and transmission factor.
Selecting the Right Tool: For routine calculations with moderate accuracy requirements (±5%), use FRICTION_FACTOR, which automatically selects appropriate correlations based on flow regime and roughness. For high-accuracy applications requiring precision better than 1%, use CLAMOND or COLEBROOK. When flow regime spans laminar to turbulent ranges, CHURCHILL provides continuous coverage. For specialized geometries like helical coils or plate heat exchangers, use the geometry-specific correlations.
All tools in this category are implemented using NumPy and SciPy for numerical computations, with many correlations drawn from established references like Crane Technical Paper 410 and Perry’s Chemical Engineers’ Handbook.
BLASIUS
Computes the Darcy friction factor for turbulent flow in smooth pipes using the Blasius empirical relation as a function of Reynolds number.
Excel Usage
=BLASIUS(re)re(float, required): Reynolds number [-]
Returns (float): Darcy friction factor [-]
Example 1: Reynolds number 10,000
Inputs:
| re |
|---|
| 10000 |
Excel formula:
=BLASIUS(10000)Expected output:
0.03164
Example 2: Reynolds number 50,000
Inputs:
| re |
|---|
| 50000 |
Excel formula:
=BLASIUS(50000)Expected output:
0.0211589
Example 3: Reynolds number 100,000
Inputs:
| re |
|---|
| 100000 |
Excel formula:
=BLASIUS(100000)Expected output:
0.0177925
Example 4: Reynolds number 5,000
Inputs:
| re |
|---|
| 5000 |
Excel formula:
=BLASIUS(5000)Expected output:
0.0376265
Python Code
Show Code
from fluids.friction import Blasius as fluids_blasius

def blasius(re):
    """
    Calculates Darcy friction factor for turbulent flow in smooth pipes using the Blasius correlation.

    See: https://fluids.readthedocs.io/fluids.friction.html#fluids.friction.Blasius

    This example function is provided as-is without any representation of accuracy.

    Args:
        re (float): Reynolds number [-]

    Returns:
        float: Darcy friction factor [-]
    """
    try:
      re_val = float(re)
      if re_val <= 0:
        return "Error: Reynolds number must be positive."
      result = fluids_blasius(re_val)
      if result != result:
        return "Error: Result is NaN."
      if result == float('inf') or result == float('-inf'):
        return "Error: Result is not finite."
      return float(result)
    except Exception as e:
      return f"Error: {str(e)}"
Online Calculator
Reynolds number [-]
CHURCHILL
Evaluates the Churchill (1977) correlation to estimate Darcy friction factor across laminar, transitional, and turbulent pipe-flow regimes using Reynolds number and relative roughness.
Excel Usage
=CHURCHILL(Re, eD)Re(float, required): Reynolds number, [-]eD(float, required): Relative roughness, [-]
Returns (float): Darcy friction factor, [-], or error message (str) if input is invalid.
Example 1: Laminar flow regime (Re = 1000)
Inputs:
| Re | eD |
|---|---|
| 1000 | 0.0001 |
Excel formula:
=CHURCHILL(1000, 0.0001)Expected output:
0.064
Example 2: Turbulent flow regime (Re = 100000)
Inputs:
| Re | eD |
|---|---|
| 100000 | 0.0001 |
Excel formula:
=CHURCHILL(100000, 0.0001)Expected output:
0.0184626
Example 3: Transition flow regime (Re = 3000)
Inputs:
| Re | eD |
|---|---|
| 3000 | 0.0001 |
Excel formula:
=CHURCHILL(3000, 0.0001)Expected output:
0.043049
Example 4: Higher roughness value (Re = 100000, eD = 0.01)
Inputs:
| Re | eD |
|---|---|
| 100000 | 0.01 |
Excel formula:
=CHURCHILL(100000, 0.01)Expected output:
0.0387336
Python Code
Show Code
from fluids.friction import Churchill_1977 as fluids_churchill_1977

def churchill(Re, eD):
    """
    Calculate Darcy friction factor using the Churchill (1977) universal equation for all flow regimes.

    See: https://fluids.readthedocs.io/fluids.friction.html#fluids.friction.Churchill_1977

    This example function is provided as-is without any representation of accuracy.

    Args:
        Re (float): Reynolds number, [-]
        eD (float): Relative roughness, [-]

    Returns:
        float: Darcy friction factor, [-], or error message (str) if input is invalid.
    """
    try:
      Re = float(Re)
      eD = float(eD)

      if Re <= 0:
        return "Error: Reynolds number must be positive."

      if eD < 0:
        return "Error: Relative roughness cannot be negative."

      result = fluids_churchill_1977(Re=Re, eD=eD)

      if result != result:
        return "Error: Result is NaN."
      if result == float('inf') or result == float('-inf'):
        return "Error: Result is not finite."

      return float(result)
    except Exception as e:
      return f"Error: {str(e)}"
Online Calculator
Reynolds number, [-]
Relative roughness, [-]
CLAMOND
Computes Darcy friction factor with the Clamond method, a high-accuracy explicit solution to the Colebrook equation using Reynolds number, relative roughness, and an optional fast mode.
Excel Usage
=CLAMOND(Re, eD, fast)Re(float, required): Reynolds number, [-]eD(float, required): Relative roughness (roughness/diameter), [-]fast(bool, optional, default: false): If true, performs single iteration with roughly half the decimals of accuracy, [-]
Returns (float): Darcy friction factor, [-], or error message (str) if input is invalid.
Example 1: Standard turbulent flow case
Inputs:
| Re | eD |
|---|---|
| 100000 | 0.0001 |
Excel formula:
=CLAMOND(100000, 0.0001)Expected output:
0.0185139
Example 2: Smooth pipe (very low roughness)
Inputs:
| Re | eD |
|---|---|
| 100000 | 0.000001 |
Excel formula:
=CLAMOND(100000, 0.000001)Expected output:
0.0179952
Example 3: Rough pipe (higher roughness)
Inputs:
| Re | eD |
|---|---|
| 100000 | 0.01 |
Excel formula:
=CLAMOND(100000, 0.01)Expected output:
0.0385035
Example 4: Fast mode with single iteration
Inputs:
| Re | eD | fast |
|---|---|---|
| 100000 | 0.0001 | true |
Excel formula:
=CLAMOND(100000, 0.0001, TRUE)Expected output:
0.0185149
Example 5: High Reynolds number flow
Inputs:
| Re | eD |
|---|---|
| 1000000 | 0.0001 |
Excel formula:
=CLAMOND(1000000, 0.0001)Expected output:
0.0134414
Python Code
Show Code
from fluids.friction import Clamond as fluids_clamond

def clamond(Re, eD, fast=False):
    """
    Calculate Darcy friction factor using Clamond's high-precision solution accurate to nearly machine precision.

    See: https://fluids.readthedocs.io/fluids.friction.html#fluids.friction.Clamond

    This example function is provided as-is without any representation of accuracy.

    Args:
        Re (float): Reynolds number, [-]
        eD (float): Relative roughness (roughness/diameter), [-]
        fast (bool, optional): If true, performs single iteration with roughly half the decimals of accuracy, [-] Default is False.

    Returns:
        float: Darcy friction factor, [-], or error message (str) if input is invalid.
    """
    try:
      Re = float(Re)
      eD = float(eD)
      fast = bool(fast)

      if Re <= 0:
        return "Error: Reynolds number must be positive."

      if eD < 0:
        return "Error: Relative roughness must be non-negative."

      result = fluids_clamond(Re=Re, eD=eD, fast=fast)

      if result != result:
        return "Error: Result is NaN."
      if result == float('inf') or result == float('-inf'):
        return "Error: Result is not finite."

      return float(result)
    except Exception as e:
      return f"Error: {str(e)}"
Online Calculator
Reynolds number, [-]
Relative roughness (roughness/diameter), [-]
If true, performs single iteration with roughly half the decimals of accuracy, [-]
COLEBROOK
Solves the Colebrook equation for Darcy friction factor from Reynolds number and relative roughness, with an optional tolerance parameter to control analytical or numerical solution behavior.
Excel Usage
=COLEBROOK(Re, eD, tol)Re(float, required): Reynolds number, [-]eD(float, required): Relative roughness (roughness/diameter), [-]tol(float, optional, default: null): Solution tolerance. None = analytical (default), 0 = mpmath exact, user value = numerical solution, [-]
Returns (float): Darcy friction factor, [-], or error message (str) if input is invalid.
Example 1: Standard turbulent flow case
Inputs:
| Re | eD |
|---|---|
| 100000 | 0.0001 |
Excel formula:
=COLEBROOK(100000, 0.0001)Expected output:
0.0185139
Example 2: Smooth pipe (very low roughness)
Inputs:
| Re | eD |
|---|---|
| 100000 | 0.000001 |
Excel formula:
=COLEBROOK(100000, 0.000001)Expected output:
0.0179952
Example 3: Rough pipe (higher roughness)
Inputs:
| Re | eD |
|---|---|
| 100000 | 0.01 |
Excel formula:
=COLEBROOK(100000, 0.01)Expected output:
0.0385035
Example 4: High Reynolds number flow
Inputs:
| Re | eD |
|---|---|
| 1000000 | 0.0001 |
Excel formula:
=COLEBROOK(1000000, 0.0001)Expected output:
0.0134414
Example 5: Numerical solution with tolerance
Inputs:
| Re | eD | tol |
|---|---|---|
| 100000 | 0.0001 | 0.0001 |
Excel formula:
=COLEBROOK(100000, 0.0001, 0.0001)Expected output:
0.0185139
Python Code
Show Code
from fluids.friction import Colebrook as fluids_colebrook

def colebrook(Re, eD, tol=None):
    """
    Calculate Darcy friction factor using exact solution to the Colebrook equation.

    See: https://fluids.readthedocs.io/fluids.friction.html#fluids.friction.Colebrook

    This example function is provided as-is without any representation of accuracy.

    Args:
        Re (float): Reynolds number, [-]
        eD (float): Relative roughness (roughness/diameter), [-]
        tol (float, optional): Solution tolerance. None = analytical (default), 0 = mpmath exact, user value = numerical solution, [-] Default is None.

    Returns:
        float: Darcy friction factor, [-], or error message (str) if input is invalid.
    """
    try:
      Re = float(Re)
      eD = float(eD)

      if tol is not None:
        tol = float(tol)

      if Re <= 0:
        return "Error: Reynolds number must be positive."

      if eD < 0:
        return "Error: Relative roughness must be non-negative."

      result = fluids_colebrook(Re=Re, eD=eD, tol=tol)

      if result != result:
        return "Error: Result is NaN."
      if result == float('inf') or result == float('-inf'):
        return "Error: Result is not finite."

      return float(result)
    except OverflowError:
      return "Error: Overflow in calculation. Try using numerical solution with tol parameter."
    except Exception as e:
      return f"Error: {str(e)}"
Online Calculator
Reynolds number, [-]
Relative roughness (roughness/diameter), [-]
Solution tolerance. None = analytical (default), 0 = mpmath exact, user value = numerical solution, [-]
DP_GRAV
Calculates the pressure-drop contribution due to gravity for single-phase flow in an inclined pipe from angle, density, length, and gravitational acceleration.
Excel Usage
=DP_GRAV(angle, rho, L, g)angle(float, required): Pipe angle relative to horizontal [degrees]rho(float, required): Fluid density [kg/m³]L(float, optional, default: 1): Pipe length [m]g(float, optional, default: 9.80665): Gravitational acceleration [m/s²]
Returns (float): Gravitational pressure drop. If L=1, returns per unit length [Pa/m]; otherwise total [Pa]. Returns error message (str) if input is invalid.
Example 1: Horizontal pipe (no gravitational drop)
Inputs:
| angle | rho |
|---|---|
| 0 | 1000 |
Excel formula:
=DP_GRAV(0, 1000)Expected output:
0
Example 2: Upward flow at 45 degrees (water)
Inputs:
| angle | rho |
|---|---|
| 45 | 1000 |
Excel formula:
=DP_GRAV(45, 1000)Expected output:
6934.35
Example 3: Downward flow at -30 degrees (oil)
Inputs:
| angle | rho | L |
|---|---|---|
| -30 | 850 | 10 |
Excel formula:
=DP_GRAV(-30, 850, 10)Expected output:
-41678.3
Example 4: Vertical pipe (90 degrees, air)
Inputs:
| angle | rho | L | g |
|---|---|---|---|
| 90 | 2.6 | 4 | 9.80665 |
Excel formula:
=DP_GRAV(90, 2.6, 4, 9.80665)Expected output:
101.989
Python Code
Show Code
from fluids.friction import one_phase_dP_gravitational as fluids_dp_grav

def dp_grav(angle, rho, L=1, g=9.80665):
    """
    Calculate gravitational pressure drop component for single-phase flow in inclined pipes.

    See: https://fluids.readthedocs.io/fluids.friction.html#fluids.friction.one_phase_dP_gravitational

    This example function is provided as-is without any representation of accuracy.

    Args:
        angle (float): Pipe angle relative to horizontal [degrees]
        rho (float): Fluid density [kg/m³]
        L (float, optional): Pipe length [m] Default is 1.
        g (float, optional): Gravitational acceleration [m/s²] Default is 9.80665.

    Returns:
        float: Gravitational pressure drop. If L=1, returns per unit length [Pa/m]; otherwise total [Pa]. Returns error message (str) if input is invalid.
    """
    try:
      angle = float(angle)
      rho = float(rho)
      L = float(L)
      g = float(g)

      if rho <= 0:
        return "Error: Fluid density (rho) must be positive."

      if L <= 0:
        return "Error: Pipe length (L) must be positive."

      if g <= 0:
        return "Error: Gravitational acceleration (g) must be positive."

      result = fluids_dp_grav(angle=angle, rho=rho, L=L, g=g)

      if result != result:
        return "Error: Result is NaN."
      if result == float('inf') or result == float('-inf'):
        return "Error: Result is not finite."

      return float(result)
    except Exception as e:
      return f"Error: {str(e)}"
Online Calculator
Pipe angle relative to horizontal [degrees]
Fluid density [kg/m³]
Pipe length [m]
Gravitational acceleration [m/s²]
FF_CURVED
Estimates friction factor for curved-pipe or helical-coil flow by selecting laminar or turbulent correlations from Reynolds number and geometry, with optional method overrides.
Excel Usage
=FF_CURVED(Re, Di, Dc, roughness, ff_curved_method, rec_method, laminar_method, turbulent_method, Darcy)Re(float, required): Reynolds number with D=Di, [-]Di(float, required): Inner diameter of the tube making up the coil, [m]Dc(float, required): Diameter of the helix/coil (center-to-center), [m]roughness(float, optional, default: 0): Roughness of pipe wall, [m]ff_curved_method(str, optional, default: null): Specific correlation method to use, overriding automatic selectionrec_method(str, optional, default: “Schmidt”): Critical Re transition methodlaminar_method(str, optional, default: “Schmidt laminar”): Laminar regime correlationturbulent_method(str, optional, default: “Schmidt turbulent”): Turbulent regime correlationDarcy(bool, optional, default: true): If false, returns Fanning friction factor
Returns (float): Friction factor, [-]
Example 1: Turbulent flow with default parameters
Inputs:
| Re | Di | Dc |
|---|---|---|
| 100000 | 0.02 | 0.5 |
Excel formula:
=FF_CURVED(100000, 0.02, 0.5)Expected output:
0.022962
Example 2: Laminar flow in helical coil
Inputs:
| Re | Di | Dc |
|---|---|---|
| 250 | 0.02 | 0.1 |
Excel formula:
=FF_CURVED(250, 0.02, 0.1)Expected output:
0.474607
Example 3: Turbulent flow with pipe roughness
Inputs:
| Re | Di | Dc | roughness |
|---|---|---|---|
| 50000 | 0.01 | 0.2 | 0.0001 |
Excel formula:
=FF_CURVED(50000, 0.01, 0.2, 0.0001)Expected output:
0.0494035
Example 4: Return Fanning friction factor instead of Darcy
Inputs:
| Re | Di | Dc | Darcy |
|---|---|---|---|
| 100000 | 0.02 | 0.5 | false |
Excel formula:
=FF_CURVED(100000, 0.02, 0.5, FALSE)Expected output:
0.0057405
Example 5: Turbulent flow with Guo method
Inputs:
| Re | Di | Dc | ff_curved_method |
|---|---|---|---|
| 200000 | 0.01 | 0.2 | Guo |
Excel formula:
=FF_CURVED(200000, 0.01, 0.2, "Guo")Expected output:
0.0221892
Python Code
Show Code
from fluids.friction import friction_factor_curved as fluids_friction_factor_curved

def ff_curved(Re, Di, Dc, roughness=0, ff_curved_method=None, rec_method='Schmidt', laminar_method='Schmidt laminar', turbulent_method='Schmidt turbulent', Darcy=True):
    """
    Calculate friction factor for fluid flowing in a curved pipe or helical coil, supporting both laminar and turbulent regimes.

    See: https://fluids.readthedocs.io/fluids.friction.html#fluids.friction.friction_factor_curved

    This example function is provided as-is without any representation of accuracy.

    Args:
        Re (float): Reynolds number with D=Di, [-]
        Di (float): Inner diameter of the tube making up the coil, [m]
        Dc (float): Diameter of the helix/coil (center-to-center), [m]
        roughness (float, optional): Roughness of pipe wall, [m] Default is 0.
        ff_curved_method (str, optional): Specific correlation method to use, overriding automatic selection Valid options: White, Mori Nakayama laminar, Schmidt laminar, Guo, Ju, Schmidt turbulent, Prasad, Mandal Nigam, Mori Nakayama turbulent, Czop. Default is None.
        rec_method (str, optional): Critical Re transition method Valid options: Seth Stahel, Ito, Kubair Kuloor, Kutateladze Borishanskii, Schmidt, Srinivasan. Default is 'Schmidt'.
        laminar_method (str, optional): Laminar regime correlation Valid options: White, Mori Nakayama laminar, Schmidt laminar. Default is 'Schmidt laminar'.
        turbulent_method (str, optional): Turbulent regime correlation Valid options: Guo, Ju, Schmidt turbulent, Prasad, Mandal Nigam, Mori Nakayama turbulent, Czop. Default is 'Schmidt turbulent'.
        Darcy (bool, optional): If false, returns Fanning friction factor Default is True.

    Returns:
        float: Friction factor, [-]
    """
    try:
      Re = float(Re)
      Di = float(Di)
      Dc = float(Dc)
      roughness = float(roughness)
      rec_method = str(rec_method)
      laminar_method = str(laminar_method)
      turbulent_method = str(turbulent_method)

      if Re <= 0:
        return "Error: Reynolds number must be positive."
      if Di <= 0:
        return "Error: Inner diameter must be positive."
      if Dc <= 0:
        return "Error: Coil diameter must be positive."
      if roughness < 0:
        return "Error: Roughness cannot be negative."

      if ff_curved_method in (None, ""):
        ff_curved_method = None

      result = fluids_friction_factor_curved(
        Re=Re,
        Di=Di,
        Dc=Dc,
        roughness=roughness,
        Method=ff_curved_method,
        Rec_method=rec_method,
        laminar_method=laminar_method,
        turbulent_method=turbulent_method,
        Darcy=Darcy
      )

      if result != result:
        return "Error: Result is NaN."
      if result == float('inf') or result == float('-inf'):
        return "Error: Result is not finite."

      return float(result)
    except Exception as e:
      return f"Error: {str(e)}"
Online Calculator
Reynolds number with D=Di, [-]
Inner diameter of the tube making up the coil, [m]
Diameter of the helix/coil (center-to-center), [m]
Roughness of pipe wall, [m]
Specific correlation method to use, overriding automatic selection
Critical Re transition method
Laminar regime correlation
Turbulent regime correlation
If false, returns Fanning friction factor
FP_MARTIN
Computes Darcy friction factor for single-phase flow in chevron plate heat exchangers using the Martin (1999) correlation based on Reynolds number and chevron angle.
Excel Usage
=FP_MARTIN(Re, chevron_angle)Re(float, required): Reynolds number with respect to the hydraulic diameter of the channels, [-]chevron_angle(float, required): Angle of the plate corrugations with respect to the vertical axis (0-90 degrees)
Returns (float): Darcy friction factor, [-], or error message (str) if input is invalid.
Example 1: Laminar flow with low chevron angle
Inputs:
| Re | chevron_angle |
|---|---|
| 500 | 30 |
Excel formula:
=FP_MARTIN(500, 30)Expected output:
0.549801
Example 2: Laminar flow with high chevron angle
Inputs:
| Re | chevron_angle |
|---|---|
| 1000 | 60 |
Excel formula:
=FP_MARTIN(1000, 60)Expected output:
2.05016
Example 3: Turbulent flow with moderate chevron angle
Inputs:
| Re | chevron_angle |
|---|---|
| 5000 | 45 |
Excel formula:
=FP_MARTIN(5000, 45)Expected output:
0.834656
Example 4: Turbulent flow with high Reynolds number
Inputs:
| Re | chevron_angle |
|---|---|
| 20000 | 45 |
Excel formula:
=FP_MARTIN(20000, 45)Expected output:
0.781892
Python Code
Show Code
from fluids.friction import friction_plate_Martin_1999 as fluids_fp_martin

def fp_martin(Re, chevron_angle):
    """
    Calculate Darcy friction factor for single-phase flow in Chevron-style plate heat exchangers using Martin (1999) correlation.

    See: https://fluids.readthedocs.io/fluids.friction.html#fluids.friction.friction_plate_Martin_1999

    This example function is provided as-is without any representation of accuracy.

    Args:
        Re (float): Reynolds number with respect to the hydraulic diameter of the channels, [-]
        chevron_angle (float): Angle of the plate corrugations with respect to the vertical axis (0-90 degrees)

    Returns:
        float: Darcy friction factor, [-], or error message (str) if input is invalid.
    """
    try:
      Re = float(Re)
      chevron_angle = float(chevron_angle)

      if Re <= 0:
        return "Error: Reynolds number must be positive."

      if chevron_angle < 0 or chevron_angle > 90:
        return "Error: Chevron angle must be between 0 and 90 degrees."

      result = fluids_fp_martin(Re=Re, chevron_angle=chevron_angle)

      if result != result:
        return "Error: Result is NaN."
      if result == float('inf') or result == float('-inf'):
        return "Error: Result is not finite."

      return float(result)
    except Exception as e:
      return f"Error: {str(e)}"
Online Calculator
Reynolds number with respect to the hydraulic diameter of the channels, [-]
Angle of the plate corrugations with respect to the vertical axis (0-90 degrees)
FP_MULEY_MANGLIK
Computes Darcy friction factor for chevron plate heat exchangers with the Muley-Manglik correlation using Reynolds number, chevron angle, and plate enlargement factor.
Excel Usage
=FP_MULEY_MANGLIK(Re, chevron_angle, plate_enlargement_factor)Re(float, required): Reynolds number with respect to the hydraulic diameter of the channels, [-]chevron_angle(float, required): Angle of the plate corrugations with respect to the vertical axis (0-90 degrees)plate_enlargement_factor(float, required): Extra surface area multiplier from corrugations (>1.0), [-]
Returns (float): Darcy friction factor, [-], or error message (str) if input is invalid.
Example 1: Typical operating conditions
Inputs:
| Re | chevron_angle | plate_enlargement_factor |
|---|---|---|
| 2000 | 45 | 1.2 |
Excel formula:
=FP_MULEY_MANGLIK(2000, 45, 1.2)Expected output:
1.08809
Example 2: Low chevron angle (30 degrees)
Inputs:
| Re | chevron_angle | plate_enlargement_factor |
|---|---|---|
| 5000 | 30 | 1.25 |
Excel formula:
=FP_MULEY_MANGLIK(5000, 30, 1.25)Expected output:
0.849647
Example 3: High chevron angle (60 degrees)
Inputs:
| Re | chevron_angle | plate_enlargement_factor |
|---|---|---|
| 3000 | 60 | 1.3 |
Excel formula:
=FP_MULEY_MANGLIK(3000, 60, 1.3)Expected output:
2.03248
Example 4: Higher Reynolds number with moderate angle
Inputs:
| Re | chevron_angle | plate_enlargement_factor |
|---|---|---|
| 10000 | 50 | 1.15 |
Excel formula:
=FP_MULEY_MANGLIK(10000, 50, 1.15)Expected output:
0.717685
Python Code
Show Code
from fluids.friction import friction_plate_Muley_Manglik as fluids_fp_muley_manglik

def fp_muley_manglik(Re, chevron_angle, plate_enlargement_factor):
    """
    Calculate Darcy friction factor for single-phase flow in Chevron-style plate heat exchangers using Muley-Manglik correlation.

    See: https://fluids.readthedocs.io/fluids.friction.html#fluids.friction.friction_plate_Muley_Manglik

    This example function is provided as-is without any representation of accuracy.

    Args:
        Re (float): Reynolds number with respect to the hydraulic diameter of the channels, [-]
        chevron_angle (float): Angle of the plate corrugations with respect to the vertical axis (0-90 degrees)
        plate_enlargement_factor (float): Extra surface area multiplier from corrugations (>1.0), [-]

    Returns:
        float: Darcy friction factor, [-], or error message (str) if input is invalid.
    """
    try:
      Re = float(Re)
      chevron_angle = float(chevron_angle)
      plate_enlargement_factor = float(plate_enlargement_factor)

      if Re <= 0:
        return "Error: Reynolds number must be positive."

      if chevron_angle < 0 or chevron_angle > 90:
        return "Error: Chevron angle must be between 0 and 90 degrees."

      if plate_enlargement_factor <= 1.0:
        return "Error: Plate enlargement factor must be greater than 1.0."

      result = fluids_fp_muley_manglik(
        Re=Re,
        chevron_angle=chevron_angle,
        plate_enlargement_factor=plate_enlargement_factor
      )

      if result != result:
        return "Error: Result is NaN."
      if result == float('inf') or result == float('-inf'):
        return "Error: Result is not finite."

      return float(result)
    except Exception as e:
      return f"Error: {str(e)}"
Online Calculator
Reynolds number with respect to the hydraulic diameter of the channels, [-]
Angle of the plate corrugations with respect to the vertical axis (0-90 degrees)
Extra surface area multiplier from corrugations (>1.0), [-]
FRICTION_FACTOR
Calculates pipe-flow friction factor using the fluids library method set, with automatic laminar handling and selectable turbulent correlations based on Reynolds number and relative roughness.
Excel Usage
=FRICTION_FACTOR(Re, eD, friction_method, Darcy)Re(float, required): Reynolds number, [-]eD(float, optional, default: 0): Relative roughness (roughness/diameter), [-]friction_method(str, optional, default: “Clamond”): Calculation method for friction factorDarcy(bool, optional, default: true): If true, returns Darcy friction factor; otherwise Fanning factor (1/4 of Darcy)
Returns (float): Friction factor, [-] str: Error message if inputs are invalid.
Example 1: Laminar flow (Re < 2040)
Inputs:
| Re | eD |
|---|---|
| 1000 | 0 |
Excel formula:
=FRICTION_FACTOR(1000, 0)Expected output:
0.064
Example 2: Turbulent flow in smooth pipe
Inputs:
| Re | eD |
|---|---|
| 100000 | 0.0001 |
Excel formula:
=FRICTION_FACTOR(100000, 0.0001)Expected output:
0.0185139
Example 3: Turbulent flow with Haaland method
Inputs:
| Re | eD | friction_method |
|---|---|---|
| 100000 | 0.001 | Haaland |
Excel formula:
=FRICTION_FACTOR(100000, 0.001, "Haaland")Expected output:
0.0219662
Example 4: Return Fanning friction factor
Inputs:
| Re | eD | Darcy |
|---|---|---|
| 100000 | 0.0001 | false |
Excel formula:
=FRICTION_FACTOR(100000, 0.0001, FALSE)Expected output:
0.00462847
Python Code
Show Code
from fluids.friction import friction_factor as fluids_friction_factor

def friction_factor(Re, eD=0, friction_method='Clamond', Darcy=True):
    """
    Calculate the Darcy friction factor for fluid flow in a pipe using various correlations, automatically selecting appropriate method based on Reynolds number and relative roughness.

    See: https://fluids.readthedocs.io/fluids.friction.html#fluids.friction.friction_factor

    This example function is provided as-is without any representation of accuracy.

    Args:
        Re (float): Reynolds number, [-]
        eD (float, optional): Relative roughness (roughness/diameter), [-] Default is 0.
        friction_method (str, optional): Calculation method for friction factor Valid options: Clamond, Colebrook, Moody, Churchill_1977, Haaland, Swamee_Jain_1976, Jain_1976, Alshul_1952, Wood_1966, Churchill_1973, Eck_1973, Chen_1979, Round_1980, Shacham_1980, Barr_1981, Zigrang_Sylvester_1, Zigrang_Sylvester_2, Serghides_1, Serghides_2, Tsal_1989, Manadilli_1997, Romeo_2002, Sonnad_Goudar_2006, Rao_Kumar_2007, Buzzelli_2008, Avci_Karagoz_2009, Papaevangelo_2010, Brkic_2011_1, Brkic_2011_2, Fang_2011. Default is 'Clamond'.
        Darcy (bool, optional): If true, returns Darcy friction factor; otherwise Fanning factor (1/4 of Darcy) Default is True.

    Returns:
        float: Friction factor, [-] str: Error message if inputs are invalid.
    """
    try:
      Re = float(Re)
      eD = float(eD)
      friction_method = str(friction_method)
      Darcy = bool(Darcy)

      if Re <= 0:
        return "Error: Reynolds number must be positive."

      if eD < 0:
        return "Error: Relative roughness must be non-negative."

      result = fluids_friction_factor(Re=Re, eD=eD, Method=friction_method, Darcy=Darcy)

      if result != result:
        return "Error: Result is NaN."
      if result == float('inf') or result == float('-inf'):
        return "Error: Result is not finite."

      return float(result)
    except Exception as e:
      return f"Error: {str(e)}"
Online Calculator
Reynolds number, [-]
Relative roughness (roughness/diameter), [-]
Calculation method for friction factor
If true, returns Darcy friction factor; otherwise Fanning factor (1/4 of Darcy)
FRICTION_LAMINAR
Returns Darcy friction factor for laminar pipe flow from Reynolds number using the theoretical relation f_d = 64/Re.
Excel Usage
=FRICTION_LAMINAR(Re)Re(float, required): Reynolds number, [-]
Returns (float): Darcy friction factor, [-] str: Error message if inputs are invalid.
Example 1: Typical laminar flow (Re = 128)
Inputs:
| Re |
|---|
| 128 |
Excel formula:
=FRICTION_LAMINAR(128)Expected output:
0.5
Example 2: Very low Reynolds number (Re = 10)
Inputs:
| Re |
|---|
| 10 |
Excel formula:
=FRICTION_LAMINAR(10)Expected output:
6.4
Example 3: Moderate laminar flow (Re = 500)
Inputs:
| Re |
|---|
| 500 |
Excel formula:
=FRICTION_LAMINAR(500)Expected output:
0.128
Example 4: Near transition Reynolds number (Re = 2000)
Inputs:
| Re |
|---|
| 2000 |
Excel formula:
=FRICTION_LAMINAR(2000)Expected output:
0.032
Python Code
Show Code
from fluids.friction import friction_laminar as fluids_friction_laminar

def friction_laminar(Re):
    """
    Calculate the Darcy friction factor for laminar flow using the theoretical solution fd = 64/Re.

    See: https://fluids.readthedocs.io/fluids.friction.html#fluids.friction.friction_laminar

    This example function is provided as-is without any representation of accuracy.

    Args:
        Re (float): Reynolds number, [-]

    Returns:
        float: Darcy friction factor, [-] str: Error message if inputs are invalid.
    """
    try:
      Re = float(Re)

      if Re <= 0:
        return "Error: Reynolds number must be positive."

      result = fluids_friction_laminar(Re=Re)

      if result != result:
        return "Error: Result is NaN."
      if result == float('inf') or result == float('-inf'):
        return "Error: Result is not finite."

      return float(result)
    except Exception as e:
      return f"Error: {str(e)}"
Online Calculator
Reynolds number, [-]
FT_CRANE
Calculates the Crane fully turbulent Darcy friction factor for fittings calculations as a function of pipe inner diameter.
Excel Usage
=FT_CRANE(D)D(float, required): Pipe inner diameter (m)
Returns (float): Darcy friction factor for fully turbulent flow, or error message (str).
Example 1: Typical commercial pipe 100mm diameter
Inputs:
| D |
|---|
| 0.1 |
Excel formula:
=FT_CRANE(0.1)Expected output:
0.0162885
Example 2: Small pipe diameter 25mm
Inputs:
| D |
|---|
| 0.025 |
Excel formula:
=FT_CRANE(0.025)Expected output:
0.0226175
Example 3: Large pipe diameter 500mm
Inputs:
| D |
|---|
| 0.5 |
Excel formula:
=FT_CRANE(0.5)Expected output:
0.0117825
Example 4: Medium pipe diameter 200mm
Inputs:
| D |
|---|
| 0.2 |
Excel formula:
=FT_CRANE(0.2)Expected output:
0.0140767
Python Code
Show Code
from fluids.friction import ft_Crane as fluids_ft_Crane

def ft_crane(D):
    """
    Calculate the Crane fully turbulent Darcy friction factor for flow in commercial pipe.

    See: https://fluids.readthedocs.io/fluids.friction.html#fluids.friction.ft_Crane

    This example function is provided as-is without any representation of accuracy.

    Args:
        D (float): Pipe inner diameter (m)

    Returns:
        float: Darcy friction factor for fully turbulent flow, or error message (str).
    """
    try:
      D = float(D)

      if D <= 0:
        return "Error: D must be positive."

      result = fluids_ft_Crane(D)
      if result != result:
        return "Error: Result is NaN."
      if result == float('inf') or result == float('-inf'):
        return "Error: Result is not finite."
      return float(result)
    except Exception as e:
      return f"Error: {str(e)}"
Online Calculator
Pipe inner diameter (m)
HAALAND
Computes Darcy friction factor with the Haaland explicit approximation from Reynolds number and relative roughness.
Excel Usage
=HAALAND(Re, eD)Re(float, required): Reynolds number, [-]eD(float, required): Relative roughness, [-]
Returns (float): Darcy friction factor, [-] or str error message if input is invalid.
Example 1: Smooth pipe with small relative roughness
Inputs:
| Re | eD |
|---|---|
| 100000 | 0.0001 |
Excel formula:
=HAALAND(100000, 0.0001)Expected output:
0.0182651
Example 2: Rough pipe with higher relative roughness
Inputs:
| Re | eD |
|---|---|
| 100000 | 0.01 |
Excel formula:
=HAALAND(100000, 0.01)Expected output:
0.0385385
Example 3: Lower Reynolds number in valid range
Inputs:
| Re | eD |
|---|---|
| 5000 | 0.001 |
Excel formula:
=HAALAND(5000, 0.001)Expected output:
0.0386201
Example 4: Upper Reynolds number in valid range
Inputs:
| Re | eD |
|---|---|
| 10000000 | 0.00001 |
Excel formula:
=HAALAND(10000000, 0.00001)Expected output:
0.00895798
Python Code
Show Code
from fluids.friction import Haaland as fluids_haaland

def haaland(Re, eD):
    """
    Calculate Darcy friction factor using the Haaland (1983) approximation.

    See: https://fluids.readthedocs.io/fluids.friction.html#fluids.friction.Haaland

    This example function is provided as-is without any representation of accuracy.

    Args:
        Re (float): Reynolds number, [-]
        eD (float): Relative roughness, [-]

    Returns:
        float: Darcy friction factor, [-] or str error message if input is invalid.
    """
    try:
      Re = float(Re)
      eD = float(eD)

      if Re <= 0:
        return "Error: Re must be positive."

      if eD < 0:
        return "Error: eD must be non-negative."

      result = fluids_haaland(Re=Re, eD=eD)
      if result != result:
        return "Error: Result is NaN."
      if result == float('inf') or result == float('-inf'):
        return "Error: Result is not finite."
      return float(result)
    except Exception as e:
      return f"Error: {str(e)}"
Online Calculator
Reynolds number, [-]
Relative roughness, [-]
HELICAL_RE_CRIT
Estimates the critical Reynolds number for transition in helical or curved pipes from tube and coil diameters, with selectable transition correlations.
Excel Usage
=HELICAL_RE_CRIT(Di, Dc, hrc_method)Di(float, required): Inner diameter of the tube making up the coil (m)Dc(float, required): Diameter of the helix/coil measured center-to-center (m)hrc_method(str, optional, default: “Schmidt”): Critical Reynolds number transition correlation method
Returns (float): Reynolds number for critical transition between laminar and turbulent flow, or str: Error message if inputs are invalid.
Example 1: Tight coil with default Schmidt method
Inputs:
| Di | Dc |
|---|---|
| 0.02 | 0.5 |
Excel formula:
=HELICAL_RE_CRIT(0.02, 0.5)Expected output:
6946.79
Example 2: Loose coil (large Dc) with Schmidt method
Inputs:
| Di | Dc |
|---|---|
| 0.01 | 2 |
Excel formula:
=HELICAL_RE_CRIT(0.01, 2)Expected output:
4122.9
Example 3: Using Ito method
Inputs:
| Di | Dc | hrc_method |
|---|---|---|
| 1 | 7 | Ito |
Excel formula:
=HELICAL_RE_CRIT(1, 7, "Ito")Expected output:
10730
Example 4: Using Srinivasan method
Inputs:
| Di | Dc | hrc_method |
|---|---|---|
| 1 | 7 | Srinivasan |
Excel formula:
=HELICAL_RE_CRIT(1, 7, "Srinivasan")Expected output:
11624.7
Python Code
Show Code
from fluids.friction import helical_Re_crit as fluids_helical_Re_crit

def helical_re_crit(Di, Dc, hrc_method='Schmidt'):
    """
    Calculate the transition Reynolds number for fluid flowing in a curved or helical pipe between laminar and turbulent flow.

    See: https://fluids.readthedocs.io/fluids.friction.html#fluids.friction.helical_Re_crit

    This example function is provided as-is without any representation of accuracy.

    Args:
        Di (float): Inner diameter of the tube making up the coil (m)
        Dc (float): Diameter of the helix/coil measured center-to-center (m)
        hrc_method (str, optional): Critical Reynolds number transition correlation method Valid options: Seth Stahel, Ito, Kubair Kuloor, Kutateladze Borishanskii, Schmidt, Srinivasan. Default is 'Schmidt'.

    Returns:
        float: Reynolds number for critical transition between laminar and turbulent flow, or str: Error message if inputs are invalid.
    """
    try:
      Di = float(Di)
      Dc = float(Dc)
      hrc_method = str(hrc_method)

      if Di <= 0:
        return "Error: Di must be positive."

      if Dc <= 0:
        return "Error: Dc must be positive."

      valid_methods = [
        "Seth Stahel",
        "Ito",
        "Kubair Kuloor",
        "Kutateladze Borishanskii",
        "Schmidt",
        "Srinivasan",
      ]
      if hrc_method not in valid_methods:
        return f"Error: hrc_method must be one of {valid_methods}."

      result = fluids_helical_Re_crit(Di=Di, Dc=Dc, Method=hrc_method)
      if result != result:
        return "Error: Result is NaN."
      if result == float('inf') or result == float('-inf'):
        return "Error: Result is not finite."
      return float(result)
    except Exception as e:
      return f"Error: {str(e)}"
Online Calculator
Inner diameter of the tube making up the coil (m)
Diameter of the helix/coil measured center-to-center (m)
Critical Reynolds number transition correlation method
MOODY
Computes Darcy friction factor using the Moody (1947) explicit correlation from Reynolds number and relative roughness.
Excel Usage
=MOODY(Re, eD)Re(float, required): Reynolds number, [-]eD(float, required): Relative roughness, [-]
Returns (float): Darcy friction factor, [-], or error message (str) if input is invalid.
Example 1: Smooth pipe (eD=0) at high Reynolds number
Inputs:
| Re | eD |
|---|---|
| 100000 | 0 |
Excel formula:
=MOODY(100000, 0)Expected output:
0.0173494
Example 2: Smooth pipe (eD=0) at lower Reynolds number
Inputs:
| Re | eD |
|---|---|
| 10000 | 0 |
Excel formula:
=MOODY(10000, 0)Expected output:
0.0310287
Example 3: Rough pipe with typical relative roughness
Inputs:
| Re | eD |
|---|---|
| 100000 | 0.0001 |
Excel formula:
=MOODY(100000, 0.0001)Expected output:
0.0180919
Example 4: Pipe with higher relative roughness
Inputs:
| Re | eD |
|---|---|
| 50000 | 0.005 |
Excel formula:
=MOODY(50000, 0.005)Expected output:
0.0326283
Python Code
Show Code
from fluids.friction import Moody as fluids_moody

def moody(Re, eD):
    """
    Calculate Darcy friction factor using the Moody (1947) correlation.

    See: https://fluids.readthedocs.io/fluids.friction.html#fluids.friction.Moody

    This example function is provided as-is without any representation of accuracy.

    Args:
        Re (float): Reynolds number, [-]
        eD (float): Relative roughness, [-]

    Returns:
        float: Darcy friction factor, [-], or error message (str) if input is invalid.
    """
    try:
      Re = float(Re)
      eD = float(eD)

      if Re <= 0:
        return "Error: Reynolds number must be positive."
      if eD < 0:
        return "Error: Relative roughness must be non-negative."

      result = fluids_moody(Re=Re, eD=eD)
      if result != result:
        return "Error: Result is NaN."
      if result == float('inf') or result == float('-inf'):
        return "Error: Result is not finite."
      return float(result)
    except Exception as e:
      return f"Error: {str(e)}"
Online Calculator
Reynolds number, [-]
Relative roughness, [-]
ONE_PHASE_DP
Calculates single-phase pressure drop in a pipe from flow rate, properties, geometry, and roughness using Darcy-Weisbach with selectable friction-factor methods.
Excel Usage
=ONE_PHASE_DP(m, rho, mu, D, roughness, L, dp_method)m(float, required): Mass flow rate of fluid, [kg/s]rho(float, required): Density of fluid, [kg/m³]mu(float, required): Dynamic viscosity of fluid, [Pa·s]D(float, required): Pipe inner diameter, [m]roughness(float, optional, default: 0): Pipe wall roughness, [m]L(float, optional, default: 1): Pipe length, [m]dp_method(str, optional, default: “Clamond”): Friction factor calculation method to use
Returns (float): Pressure drop, [Pa] str: Error message if inputs are invalid.
Example 1: Laminar flow pressure drop
Inputs:
| m | rho | mu | D | roughness | L |
|---|---|---|---|---|---|
| 0.01 | 1000 | 0.001 | 0.01 | 0 | 1 |
Excel formula:
=ONE_PHASE_DP(0.01, 1000, 0.001, 0.01, 0, 1)Expected output:
40.7437
Example 2: Turbulent flow in smooth pipe
Inputs:
| m | rho | mu | D | roughness | L |
|---|---|---|---|---|---|
| 10 | 1000 | 0.00001 | 0.1 | 0 | 1 |
Excel formula:
=ONE_PHASE_DP(10, 1000, 0.00001, 0.1, 0, 1)Expected output:
63.4345
Example 3: Turbulent flow in rough pipe
Inputs:
| m | rho | mu | D | roughness | L |
|---|---|---|---|---|---|
| 10 | 1000 | 0.00001 | 0.1 | 0.0001 | 10 |
Excel formula:
=ONE_PHASE_DP(10, 1000, 0.00001, 0.1, 0.0001, 10)Expected output:
1593.6
Example 4: Turbulent flow using Haaland method
Inputs:
| m | rho | mu | D | roughness | L | dp_method |
|---|---|---|---|---|---|---|
| 5 | 800 | 0.001 | 0.05 | 0.00005 | 5 | Haaland |
Excel formula:
=ONE_PHASE_DP(5, 800, 0.001, 0.05, 0.00005, 5, "Haaland")Expected output:
8726.55
Python Code
Show Code
from fluids.friction import one_phase_dP as fluids_one_phase_dP

def one_phase_dp(m, rho, mu, D, roughness=0, L=1, dp_method='Clamond'):
    """
    Calculate single-phase pressure drop in a pipe using the Darcy-Weisbach equation.

    See: https://fluids.readthedocs.io/fluids.friction.html#fluids.friction.one_phase_dP

    This example function is provided as-is without any representation of accuracy.

    Args:
        m (float): Mass flow rate of fluid, [kg/s]
        rho (float): Density of fluid, [kg/m³]
        mu (float): Dynamic viscosity of fluid, [Pa·s]
        D (float): Pipe inner diameter, [m]
        roughness (float, optional): Pipe wall roughness, [m] Default is 0.
        L (float, optional): Pipe length, [m] Default is 1.
        dp_method (str, optional): Friction factor calculation method to use Valid options: Clamond, Colebrook, Moody, Churchill_1977, Haaland, Swamee_Jain_1976. Default is 'Clamond'.

    Returns:
        float: Pressure drop, [Pa] str: Error message if inputs are invalid.
    """
    try:
      m = float(m)
      rho = float(rho)
      mu = float(mu)
      D = float(D)
      roughness = float(roughness)
      L = float(L)
      dp_method = str(dp_method)

      if D <= 0:
        return "Error: Pipe diameter must be positive."

      if rho <= 0:
        return "Error: Density must be positive."

      if mu <= 0:
        return "Error: Viscosity must be positive."

      if roughness < 0:
        return "Error: Roughness must be non-negative."

      if L <= 0:
        return "Error: Pipe length must be positive."

      if m == 0:
        return 0.0

      result = fluids_one_phase_dP(
        m=m,
        rho=rho,
        mu=mu,
        D=D,
        roughness=roughness,
        L=L,
        Method=dp_method
      )

      if result != result:
        return "Error: Result is NaN."
      if result == float('inf') or result == float('-inf'):
        return "Error: Result is not finite."

      return float(result)
    except Exception as e:
      return f"Error: {str(e)}"
Online Calculator
Mass flow rate of fluid, [kg/s]
Density of fluid, [kg/m³]
Dynamic viscosity of fluid, [Pa·s]
Pipe inner diameter, [m]
Pipe wall roughness, [m]
Pipe length, [m]
Friction factor calculation method to use
SWAMEE_JAIN
Computes Darcy friction factor with the Swamee-Jain explicit equation using Reynolds number and relative roughness for turbulent pipe flow.
Excel Usage
=SWAMEE_JAIN(Re, eD)Re(float, required): Reynolds number, [-]eD(float, required): Relative roughness (roughness/diameter), [-]
Returns (float): Darcy friction factor, [-] str: Error message if inputs are invalid.
Example 1: Smooth pipe with low Reynolds number
Inputs:
| Re | eD |
|---|---|
| 10000 | 0.000001 |
Excel formula:
=SWAMEE_JAIN(10000, 0.000001)Expected output:
0.0309738
Example 2: Smooth pipe with high Reynolds number
Inputs:
| Re | eD |
|---|---|
| 100000 | 0.0001 |
Excel formula:
=SWAMEE_JAIN(100000, 0.0001)Expected output:
0.0184524
Example 3: Rough pipe
Inputs:
| Re | eD |
|---|---|
| 50000 | 0.01 |
Excel formula:
=SWAMEE_JAIN(50000, 0.01)Expected output:
0.0394639
Example 4: Very rough pipe at upper eD limit
Inputs:
| Re | eD |
|---|---|
| 1000000 | 0.05 |
Excel formula:
=SWAMEE_JAIN(1000000, 0.05)Expected output:
0.0716069
Python Code
Show Code
from fluids.friction import Swamee_Jain_1976 as fluids_swamee_jain

def swamee_jain(Re, eD):
    """
    Calculate Darcy friction factor using the Swamee-Jain (1976) equation.

    See: https://fluids.readthedocs.io/fluids.friction.html#fluids.friction.Swamee_Jain_1976

    This example function is provided as-is without any representation of accuracy.

    Args:
        Re (float): Reynolds number, [-]
        eD (float): Relative roughness (roughness/diameter), [-]

    Returns:
        float: Darcy friction factor, [-] str: Error message if inputs are invalid.
    """
    try:
      Re = float(Re)
      eD = float(eD)

      if Re <= 0:
        return "Error: Reynolds number must be positive."

      if eD < 0:
        return "Error: Relative roughness must be non-negative."

      result = fluids_swamee_jain(Re=Re, eD=eD)

      if result != result:
        return "Error: Result is NaN."
      if result == float('inf') or result == float('-inf'):
        return "Error: Result is not finite."

      return float(result)
    except Exception as e:
      return f"Error: {str(e)}"
Online Calculator
Reynolds number, [-]
Relative roughness (roughness/diameter), [-]
TRANS_FACTOR
Converts between Darcy friction factor and transmission factor for gas-pipeline calculations, accepting exactly one of the two quantities as input.
Excel Usage
=TRANS_FACTOR(fd, F)fd(float, optional, default: null): Darcy friction factor, [-]F(float, optional, default: null): Transmission factor, [-]
Returns (float): Transmission factor (if fd given) or Darcy friction factor (if F given), [-] or str error message if input is invalid.
Example 1: Convert typical Darcy friction factor to transmission factor
Inputs:
| fd |
|---|
| 0.0185 |
Excel formula:
=TRANS_FACTOR(0.0185)Expected output:
14.7043
Example 2: Convert typical transmission factor to Darcy friction factor
Inputs:
| F |
|---|
| 20 |
Excel formula:
=TRANS_FACTOR(20)Expected output:
0.01
Example 3: Convert high friction factor to transmission factor
Inputs:
| fd |
|---|
| 0.04 |
Excel formula:
=TRANS_FACTOR(0.04)Expected output:
10
Example 4: Convert low transmission factor to Darcy friction factor
Inputs:
| F |
|---|
| 10 |
Excel formula:
=TRANS_FACTOR(10)Expected output:
0.04
Python Code
Show Code
from fluids.friction import transmission_factor as fluids_transmission_factor

def trans_factor(fd=None, F=None):
    """
    Convert between Darcy friction factor and transmission factor for compressible gas pipeline flow.

    See: https://fluids.readthedocs.io/fluids.friction.html#fluids.friction.transmission_factor

    This example function is provided as-is without any representation of accuracy.

    Args:
        fd (float, optional): Darcy friction factor, [-] Default is None.
        F (float, optional): Transmission factor, [-] Default is None.

    Returns:
        float: Transmission factor (if fd given) or Darcy friction factor (if F given), [-] or str error message if input is invalid.
    """
    try:
      if fd is not None and F is not None:
        return "Error: Provide only one of fd or F, not both."

      if fd is None and F is None:
        return "Error: Provide either fd or F."

      if fd is not None:
        fd = float(fd)
        if fd <= 0:
          return "Error: fd must be positive."

      if F is not None:
        F = float(F)
        if F <= 0:
          return "Error: F must be positive."

      result = fluids_transmission_factor(fd=fd, F=F)
      if result != result:
        return "Error: Result is NaN."
      if result == float('inf') or result == float('-inf'):
        return "Error: Result is not finite."
      return float(result)
    except Exception as e:
      return f"Error: {str(e)}"
Online Calculator
Darcy friction factor, [-]
Transmission factor, [-]
VON_KARMAN
Calculates the limiting Darcy friction factor for fully rough flow from relative roughness using the von Karman relation.
Excel Usage
=VON_KARMAN(eD)eD(float, required): Relative roughness, [-]
Returns (float): Darcy friction factor, [-], or error message (str) if input is invalid.
Example 1: Typical commercial pipe roughness
Inputs:
| eD |
|---|
| 0.0001 |
Excel formula:
=VON_KARMAN(0.0001)Expected output:
0.0119798
Example 2: Moderate roughness pipe
Inputs:
| eD |
|---|
| 0.001 |
Excel formula:
=VON_KARMAN(0.001)Expected output:
0.0196355
Example 3: Very smooth pipe (small eD)
Inputs:
| eD |
|---|
| 0.00001 |
Excel formula:
=VON_KARMAN(0.00001)Expected output:
0.00806325
Example 4: Very rough pipe (large eD)
Inputs:
| eD |
|---|
| 0.05 |
Excel formula:
=VON_KARMAN(0.05)Expected output:
0.0715507
Python Code
Show Code
from fluids.friction import von_Karman as fluids_von_karman

def von_karman(eD):
    """
    Calculate Darcy friction factor for rough pipes at infinite Reynolds number from the von Karman equation.

    See: https://fluids.readthedocs.io/fluids.friction.html#fluids.friction.von_Karman

    This example function is provided as-is without any representation of accuracy.

    Args:
        eD (float): Relative roughness, [-]

    Returns:
        float: Darcy friction factor, [-], or error message (str) if input is invalid.
    """
    try:
      eD = float(eD)

      if eD <= 0:
        return "Error: eD must be positive."

      result = fluids_von_karman(eD=eD)
      if result != result:
        return "Error: Result is NaN."
      if result == float('inf') or result == float('-inf'):
        return "Error: Result is not finite."
      return float(result)
    except Exception as e:
      return f"Error: {str(e)}"
Online Calculator
Relative roughness, [-]