Frequency Statistics
Overview
Frequency statistics form the foundation of exploratory data analysis and descriptive statistics. They quantify how often values occur within a dataset, revealing the underlying distribution of measurements. By organizing data into bins, calculating cumulative counts, and determining the position of values within the distribution, frequency statistics provide crucial insights into data structure, central tendency, and variability. These tools are essential for visualizing distributions, identifying patterns, detecting outliers, and communicating statistical properties to stakeholders.
Core Concepts: Frequency statistics are built on the concept of frequency distribution, which describes how many times each value (or range of values) appears in a dataset. This distributional information forms the basis for hypothesis testing, model validation, and exploratory analysis. Understanding frequency distributions is the first step in almost any statistical investigation because they reveal whether data are normally distributed, skewed, multimodal, or contain unexpected gaps.
Implementation: These tools are primarily powered by SciPy, a comprehensive Python library for scientific computing. SciPy’s scipy.stats module provides optimized, well-tested implementations for frequency analysis operations, ensuring both accuracy and computational efficiency across datasets of varying sizes. The binning and histogram functions integrate seamlessly with NumPy for array operations.
Binning and Aggregation: One of the most practical challenges in data analysis is reducing high-dimensional or continuous data into interpretable summary statistics. The BINNED_STATISTIC tool computes aggregated statistics (mean, median, sum, count, etc.) over binned data in one dimension, enabling you to see how a statistic varies across ranges of a predictor variable. For example, you might bin customer ages into decades and compute average spending in each bin. The BINNED_STATISTIC_2D extends this to two dimensions, allowing you to compute statistics over rectangular regions of a 2D space—useful for heatmaps, spatial analysis, or understanding interaction effects between two variables.
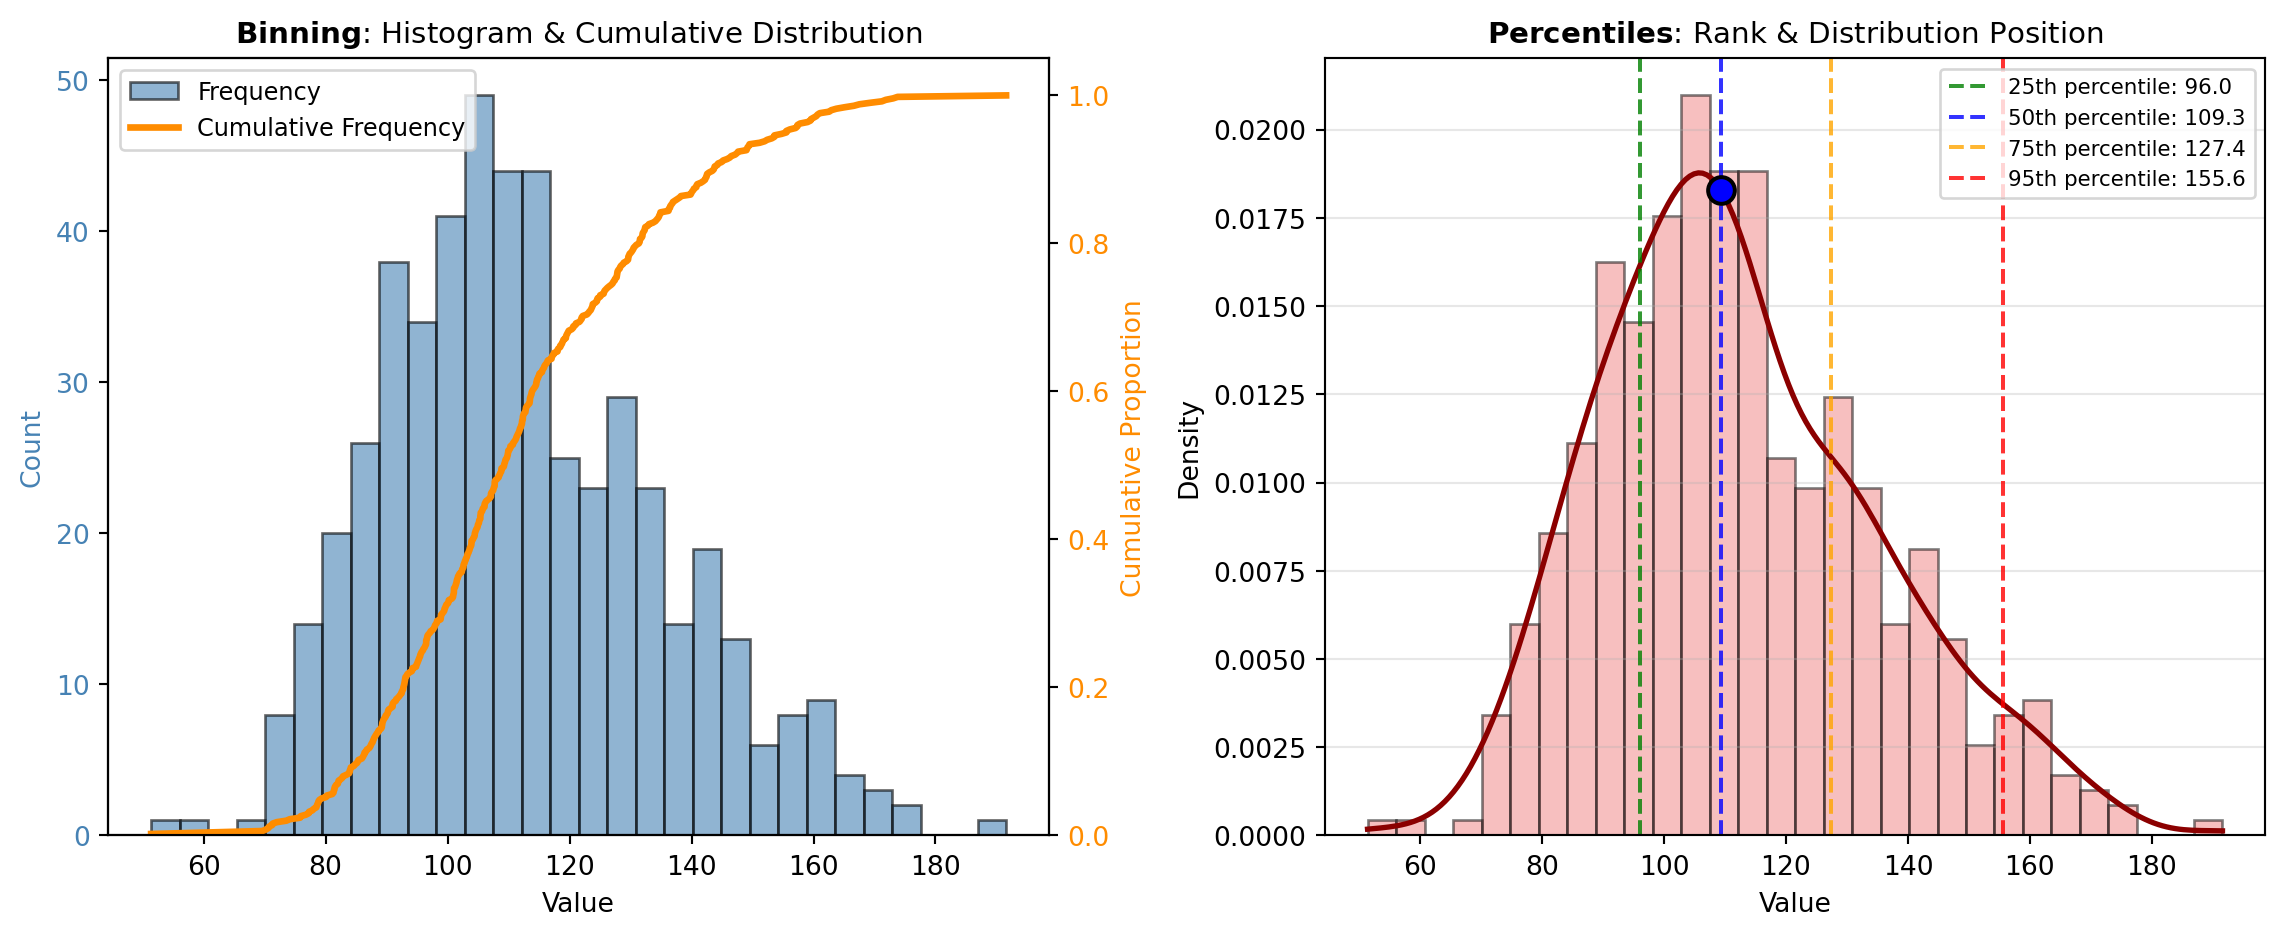
Cumulative Analysis: Understanding how values accumulate across a distribution is critical for many applications. The CUMFREQ tool computes cumulative frequencies, showing the count or proportion of observations at or below each value. This is invaluable for survival analysis, reliability engineering, and assessing the completeness of measurement coverage. Cumulative frequency curves reveal distributional shape and enable quick visual assessment of quartiles, medians, and percentiles.
Percentile Analysis: Percentiles partition a distribution into equal-probability segments and identify where specific observations rank. The PERCENTILEOFSCORE tool answers the question: “What percentile does a given score occupy in the dataset?” This is essential for ranking, grading, clinical assessment, and comparative analysis. Conversely, the SCOREATPERCENTILE tool performs the inverse operation: given a percentile (e.g., 95th), it returns the corresponding value. These tools are complementary and widely used in quality control, educational assessment, and health metrics.
Relative Frequencies: While absolute frequency counts tell you “how many,” relative frequencies tell you “what proportion.” The RELFREQ tool normalizes frequencies by the total count, producing a probability distribution that sums to 1. This normalization is essential for comparing datasets of different sizes and for estimating probability density functions. Relative frequencies form the basis for probability statements and are fundamental to statistical inference.
The visualization below illustrates how these concepts interconnect: one pane shows the relationship between binning, relative frequency, and cumulative distribution; the other demonstrates percentile interpretation in the context of an actual distribution.
Tools
| Tool | Description |
|---|---|
| BINNED_STATISTIC | Computes a binned statistic (mean, sum, median, etc.) for the input data. |
| BINNED_STATISTIC_2D | Computes a bidimensional binned statistic (mean, sum, median, etc.) for the input data. |
| CUMFREQ | Compute the cumulative frequency histogram for the input data. |
| PERCENTILEOFSCORE | Computes the percentile rank of a score relative to the input data. |
| RELFREQ | Returns the relative frequency histogram for the input data. |
| SCOREATPERCENTILE | Calculates the score at the given percentile of the input data. |