Survival Analysis
Overview
Survival Analysis is a statistical methodology for analyzing time-to-event data, where the outcome of interest is the duration until a specific event occurs. This domain is essential across numerous fields: in medicine, researchers track patient survival after diagnosis or treatment; in engineering, analysts study equipment failure times; in business, companies examine customer churn rates; and in reliability engineering, teams assess product lifespans. Unlike standard regression models that assume all observations have complete outcome information, survival analysis handles the fundamental challenge of censoring—situations where the event hasn’t occurred by study end but will eventually happen.
Censoring and Why It Matters
The defining characteristic of survival data is censoring: incomplete information about when events occurred. There are three types. Right censoring occurs when subjects haven’t experienced the event by the end of follow-up (e.g., a patient is still alive when the study concludes). Left censoring happens when the event occurred before observation began. Interval censoring occurs when we only know the event happened between two time points. Right censoring is most common and requires specialized statistical methods because ignoring it or using standard regression produces biased estimates. The Kaplan-Meier estimator handles this by accounting for subjects dropping out over time.
Implementation Framework
Survival analysis in Python is implemented through libraries like statsmodels (for regression models), lifelines (specialized survival package), and scipy (for statistical distributions). These libraries provide both non-parametric methods that make minimal assumptions about the underlying survival distribution and semi-parametric and parametric approaches that model specific functional forms.
Non-Parametric Estimation
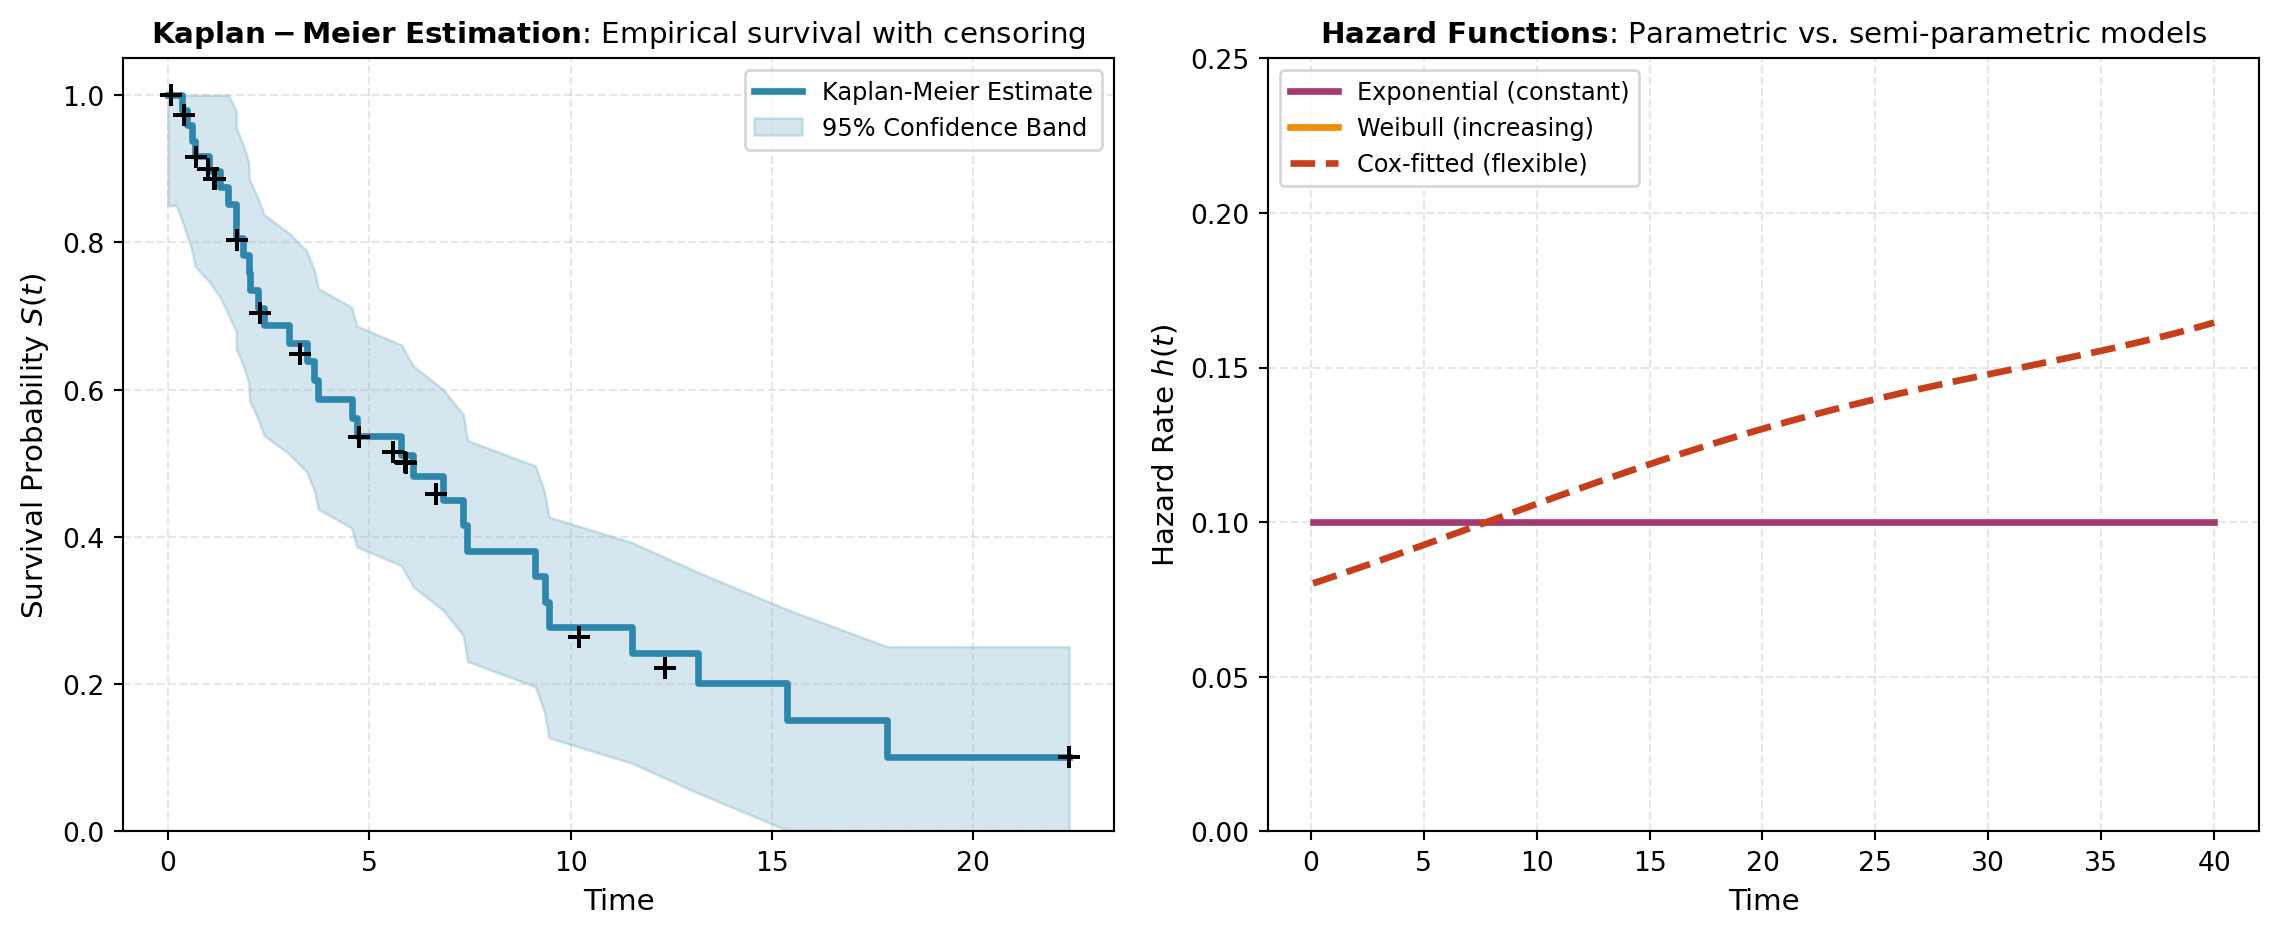
The Kaplan-Meier estimator is the cornerstone non-parametric approach. It estimates the survival function S(t) = P(T > t)—the probability that a subject survives beyond time t—directly from data without assuming any particular distribution. This makes it highly flexible and widely used for exploratory analysis, cohort comparisons, and displaying empirical survival patterns visually.
Semi-Parametric and Parametric Regression
When you need to model survival as a function of explanatory variables (covariates), regression methods become necessary. Cox Proportional Hazards (cox_hazards) is the dominant semi-parametric approach in practice. It models the hazard function (instantaneous failure rate) without assuming a specific survival distribution, making it robust and interpretable. The proportional hazards assumption states that the hazard ratio between two groups is constant over time—a requirement worth validating in practice. Parametric models like the Exponential Survival Regression assume specific survival distributions (exponential, Weibull, lognormal, etc.) and can be more efficient when the distributional assumption is correct. They also naturally accommodate time-varying effects.
When to Use Each Approach
Choose Kaplan-Meier for estimating and visualizing empirical survival curves, especially for group comparisons (e.g., treatment vs. control). Use Cox Proportional Hazards when you need to adjust for covariates while maintaining flexibility about the underlying distribution—it’s the standard in medical research. Select Exponential Survival Regression when the parametric assumption is reasonable (often after checking with goodness-of-fit tests) and you want more efficient inference, time-varying effects, or predictions beyond your observed time range.
The visualization below illustrates how censoring affects survival curve estimation and how different model assumptions produce different fitted curves.
Tools
| Tool | Description |
|---|---|
| COX_HAZARDS | Fits a Cox Proportional Hazards regression model for survival data. |
| EXP_SURVIVAL_REG | Fits a parametric exponential survival regression model. |
| KAPLAN_MEIER | Computes the Kaplan-Meier survival function estimate for time-to-event data. |