Summary Statistics
Overview
Summary statistics are used to summarize a set of observations, in order to communicate the largest amount of information as simply as possible. They form the foundation of data analysis, providing a concise snapshot of a dataset’s key properties before deeper investigation. By distilling large datasets into interpretable measures, summary statistics help analysts quickly understand data patterns, identify outliers, and make informed decisions about further analysis.
Central Tendency measures locate the “center” or typical value of a distribution. The most common include the mean (arithmetic average), median (middle value when sorted), and mode (most frequently occurring value). Each has distinct advantages: the mean leverages all data points but is sensitive to outliers, the median is robust to extreme values, and the mode identifies the most typical observation. Choosing the right central tendency measure depends on your data’s characteristics and analysis goals. For instance, DESCRIBE computes multiple central tendency statistics automatically, while MODE specifically isolates the most frequent value.
Dispersion measures quantify how spread out data points are around the center. Range, variance, and standard deviation capture different aspects of this spread. Variance measures the average squared deviation from the mean, while standard deviation is its square root, presented in the same units as the original data for easier interpretation. The interquartile range (IQR) represents the middle 50% of data, providing a robust alternative when outliers are present. Lower dispersion indicates data clusters tightly around the center; higher dispersion suggests greater variability. Understanding dispersion is critical because two datasets with identical means can have vastly different characteristics if their spreads differ.
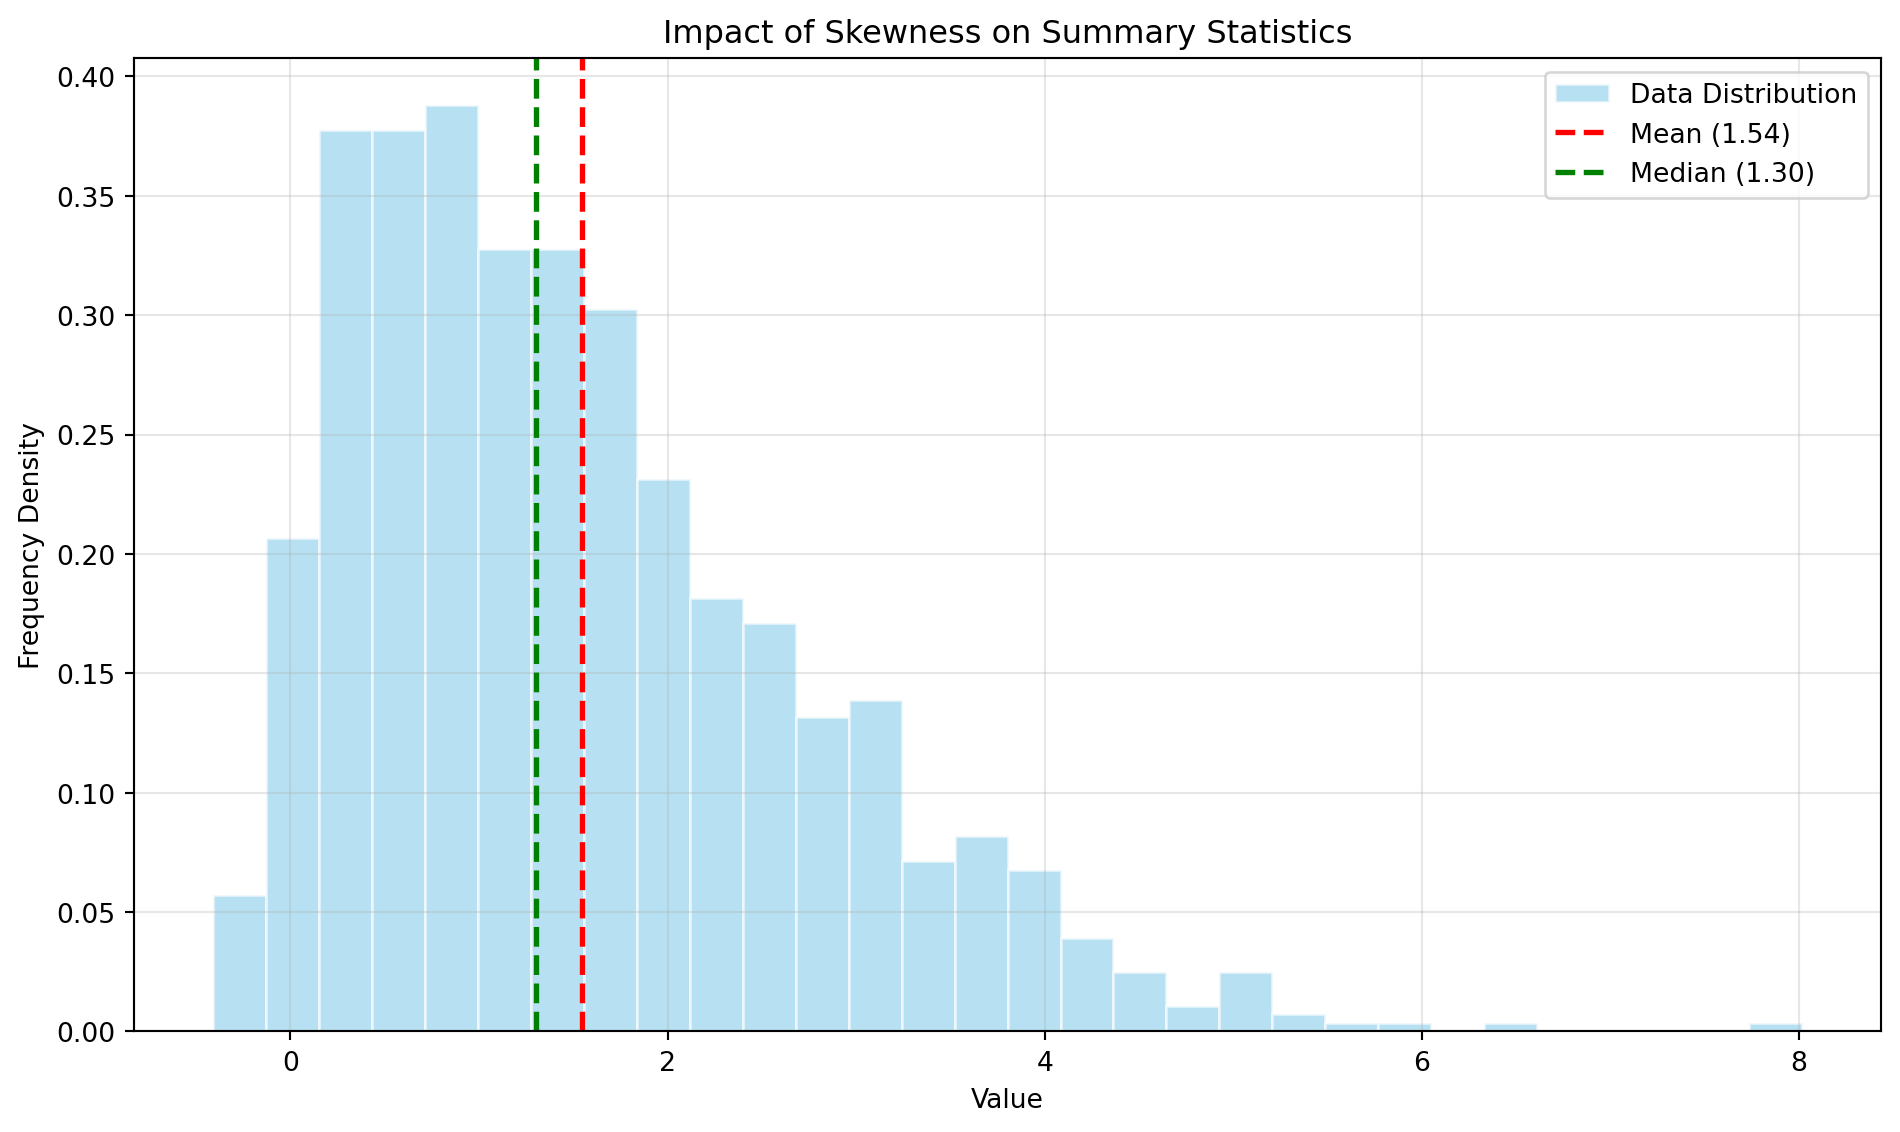
Shape describes the distribution’s symmetry and peakedness. Skewness measures asymmetry: positive skew indicates a long tail extending right, while negative skew shows a tail extending left. Symmetric distributions have skewness near zero. Kurtosis measures the distribution’s tailedness—how peaked or flat it appears compared to a normal distribution. High kurtosis suggests heavy tails with extreme values; low kurtosis indicates lighter tails. These shape metrics reveal important distributional properties that central tendency and dispersion alone cannot capture.
Beyond standard moments, specialized averages serve specific purposes. The geometric mean (computed via GMEAN) is ideal for rates of change and data spanning multiple orders of magnitude. The harmonic mean (HMEAN) suits averaging rates and ratios. The power mean or generalized mean (PMEAN) unifies these concepts under a parameter-dependent framework. These alternatives to the arithmetic mean are implemented in NumPy and SciPy, Python’s fundamental libraries for numerical computing and scientific statistics.
Higher-order moments extend beyond simple statistics. The MOMENT function calculates arbitrary moments about the mean, providing flexibility for specialized analyses. The EXPECTILE function computes expectiles—a generalization of quantiles useful in risk analysis and asymmetric loss settings. For comparing groups, EFFECT_SIZES quantifies the magnitude of differences, crucial for interpreting statistical significance in applied contexts.
Tools
| Tool | Description |
|---|---|
| DESCRIBE | Compute descriptive statistics using scipy.stats.describe. |
| EXPECTILE | Calculates the expectile of a dataset using scipy.stats.expectile. |
| GMEAN | Compute the geometric mean of the input data, flattening the input and ignoring non-numeric values. |
| HMEAN | Calculates the harmonic mean of the input data, flattening the input and ignoring non-numeric values. |
| KURTOSIS | Compute the kurtosis (Fisher or Pearson) of a dataset. |
| MODE | Return the modal (most common) numeric value in the input data, returning the smallest if there are multiple modes. |
| MOMENT | Calculates the nth moment about the mean for a sample. |
| PMEAN | Computes the power mean (generalized mean) of the input data for a given power p. |
| SKEWNESS | Calculate the skewness of a dataset. |