Statistics
Overview
Statistics is the discipline that concerns the collection, organization, analysis, interpretation, and presentation of data. It provides the mathematical framework for understanding uncertainty, making predictions, and drawing conclusions from incomplete information. Whether in science, economics, or engineering, statistical methods are essential for distinguishing signal from noise and extracting meaningful insights from data.
Background and Importance: Statistics is fundamental to science, business, engineering, and policy-making. It enables researchers and practitioners to quantify uncertainty, test hypotheses rigorously, model complex relationships in data, and make evidence-based decisions. The field has roots in probability theory and has evolved to encompass sophisticated computational methods for analyzing everything from large-scale datasets to small, carefully designed experiments.
Two Core Pillars: The field divides into Descriptive Statistics, which summarizes and organizes data to reveal main features (mean, median, variance, distribution shape), and Inferential Statistics, which uses sample data to generalize about populations, make predictions, and test theories. These complementary approaches work together: descriptive statistics summarize what you observe, while inferential statistics help you understand what it means.
Implementation Framework: Statistical analysis in Python is powered primarily by SciPy, NumPy, and Statsmodels. SciPy provides the foundational distributions and statistical tests, NumPy enables efficient numerical computations on arrays, and Statsmodels offers higher-level model fitting and diagnostics. These libraries are built on decades of research and are widely used across academia and industry.
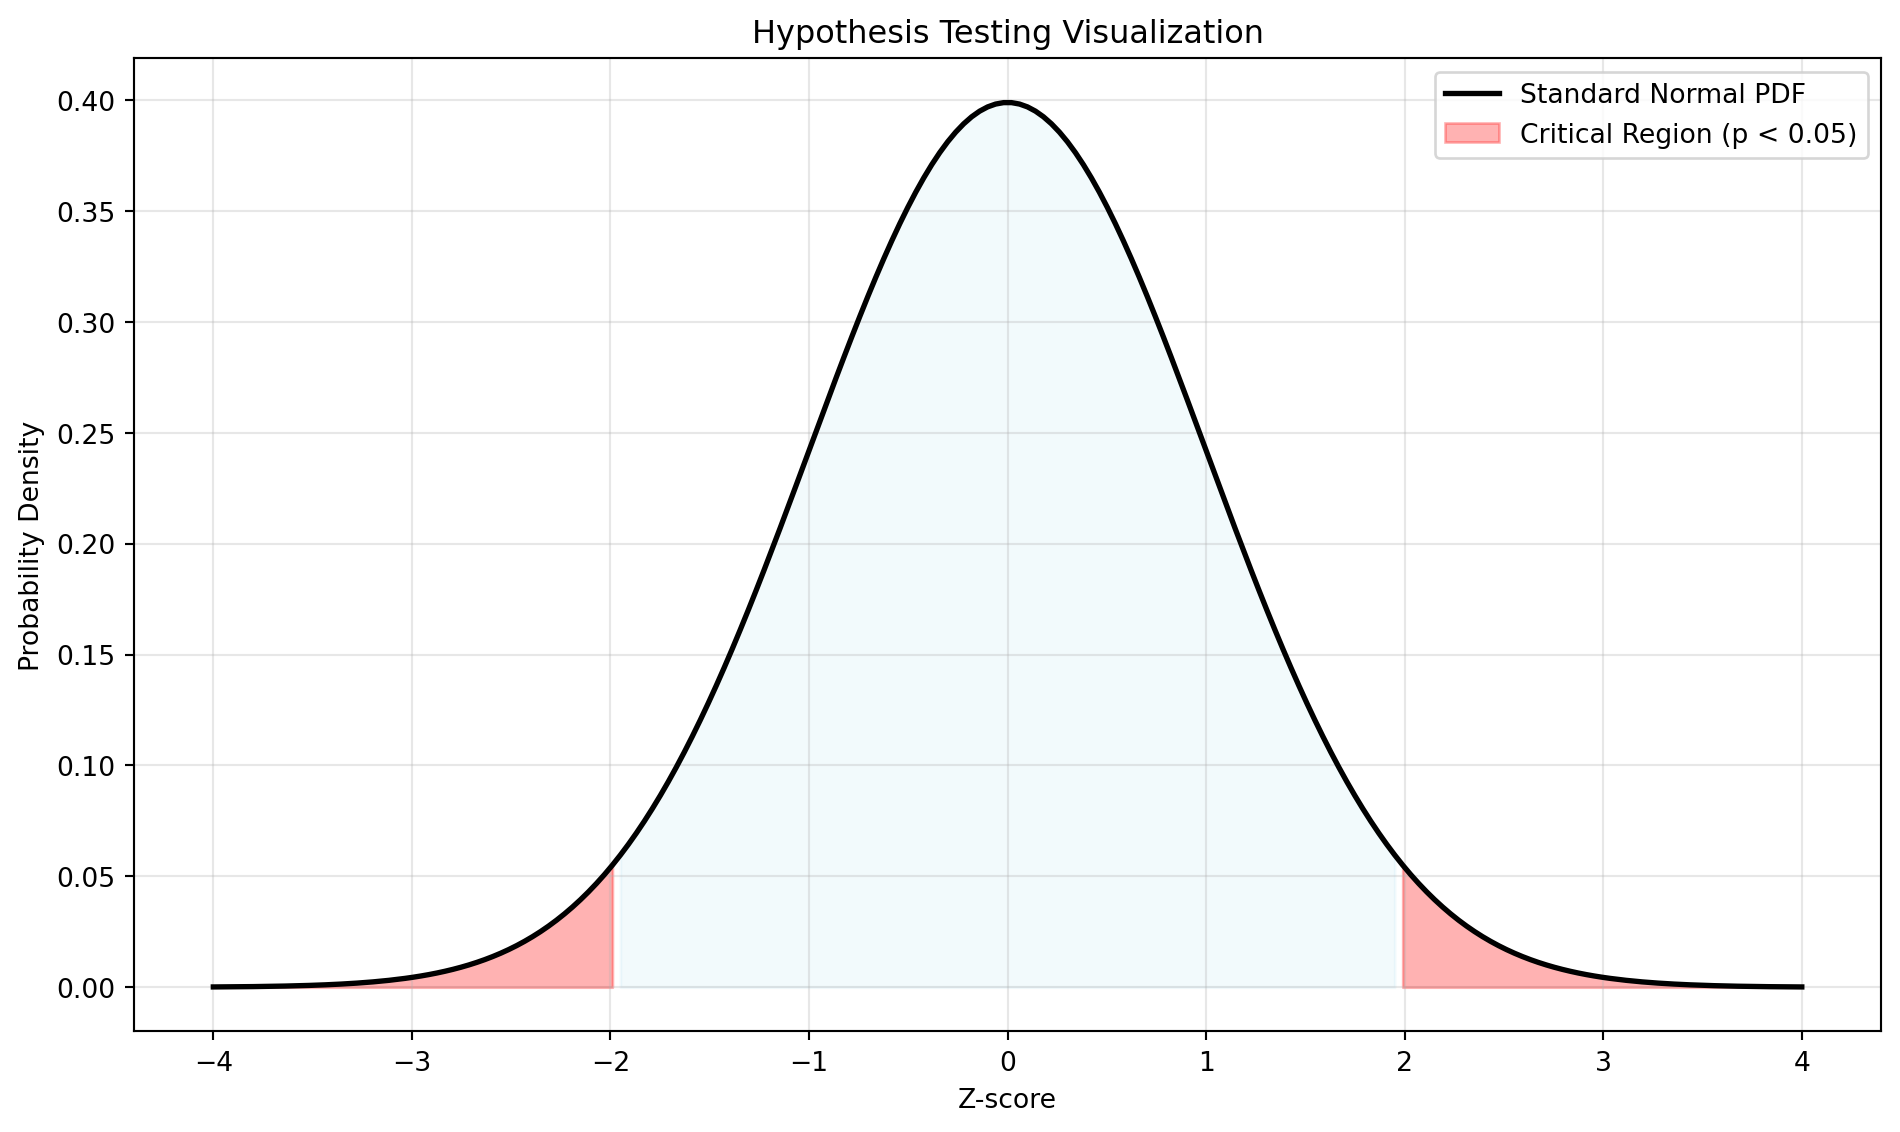
Hypothesis Testing and Inference: One of statistics’ most powerful applications is hypothesis testing—a formal process for assessing whether observed differences or patterns could arise by chance. Tests range from simple comparisons of two groups using t-tests to sophisticated approaches for categorical data (chi-square tests), non-parametric alternatives (Mann-Whitney U test), and specialized tests for association and correlation. Choosing the right test depends on data type, sample size, and assumptions about underlying distributions.
Probability Distributions: The foundation of statistical inference rests on probability distributions. Continuous distributions like the normal (Gaussian) distribution, t-distribution, F-distribution, and exponential distribution model continuous measurements. Discrete distributions like binomial, Poisson, and negative binomial handle count data. Multivariate distributions extend these concepts to multiple variables simultaneously, essential for modeling joint behavior in multivariate datasets. Understanding the properties of these distributions—their shape, tail behavior, and moments—is crucial for selecting appropriate models.
Advanced Statistical Modeling: Beyond basic hypothesis tests, regression models investigate relationships between variables: ordinary least squares (OLS) for linear relationships, quantile regression for conditional quantiles, and robust methods for data with outliers. Generalized Linear Models (GLMs) extend regression to non-normal response variables, handling binary outcomes (logistic regression), counts (Poisson regression), and survival times. Mixed effects models incorporate random variation from multiple sources, essential when data has hierarchical or clustered structure. Survival analysis specialized tools like Kaplan-Meier estimators and Cox proportional hazards models for time-to-event data common in medicine and engineering.
Multivariate and Dimensionality Reduction: When analyzing many variables simultaneously, techniques like Principal Component Analysis (PCA) reduce dimensions while preserving variance, factor analysis uncovers latent structures, canonical correlation analysis (CCA) finds relationships between variable sets, and MANOVA tests differences across multiple outcomes. These methods reveal hidden patterns and simplify interpretation of high-dimensional data.
Bayesian
Conjugate Priors
| Tool | Description |
|---|---|
| BB_LOGBETA | Compute the log-Beta term used in conjugate posterior calculations. |
| BB_POST_UPDATE | Update Beta-Binomial posterior hyperparameters from observed counts. |
| BB_QBETA | Compute a Beta posterior quantile for Beta-Binomial models. |
| GAMMA_POST_Q | Compute a Gamma posterior quantile from shape-rate parameters. |
| INVGAMMA_POST_Q | Compute an inverse-Gamma posterior quantile. |
| NIG_POST_UPDATE | Update Normal-Inverse-Gamma posterior hyperparameters from sample summaries. |
| NN_POST_UPDATE | Update Normal posterior parameters for unknown mean with known variance. |
Credible Intervals
| Tool | Description |
|---|---|
| BAYES_MVS_CI | Compute Bayesian credible intervals for mean, variance, and standard deviation from sample data. |
| BETA_CI_BOUNDS | Compute an equal-tailed Bayesian credible interval for a proportion using a Beta posterior. |
| GAMMA_CI_BOUNDS | Compute an equal-tailed Bayesian credible interval for a positive rate parameter using Gamma quantiles. |
| INVGAMMA_CI_BOUNDS | Compute an equal-tailed Bayesian credible interval for a positive scale or variance parameter using Inverse-Gamma quantiles. |
| MVSDIST_CI | Compute Bayesian credible intervals from posterior distributions of mean, variance, and standard deviation. |
| SAMPLE_EQTAIL_CI | Compute an equal-tailed credible interval from posterior samples using empirical quantiles. |
| SAMPLE_HPD_CI | Approximate a highest posterior density interval from posterior samples using the narrowest empirical window. |
Dirichlet Multinomial
| Tool | Description |
|---|---|
| DM_CRED_INT | Compute category-wise credible intervals from posterior Dirichlet parameters. |
| DM_DIRICHLET_SUM | Compute Dirichlet density and moments for a category-probability vector. |
| DM_LOGBETA | Compute the Dirichlet log-normalization term using log-gamma values. |
| DM_LOGSUM_NORM | Compute a stable log normalizer and normalized probabilities from log-values. |
| DM_POST_UPDATE | Update Dirichlet posterior parameters from prior hyperparameters and observed counts. |
| DM_PREDICTIVE | Compute posterior predictive category probabilities from Dirichlet parameters. |
Posterior Summarization
| Tool | Description |
|---|---|
| POSTERIOR_BMV | Compute Bayesian posterior summaries for mean, variance, and standard deviation. |
| POSTERIOR_ENTROPY | Compute Shannon or relative entropy for posterior probability tables. |
| POSTERIOR_LOGSUMEXP | Compute stable log-sum-exp aggregates for posterior normalization and evidence calculations. |
| POSTERIOR_MAP | Extract the MAP estimate from a tabulated posterior distribution. |
| POSTERIOR_TAILPROB | Compute posterior tail probabilities relative to a decision threshold. |
| POSTERIOR_WMEANVAR | Compute posterior weighted mean and variance summaries from values and weights. |
| POSTERIOR_XLOGY | Compute numerically stable x times log y terms for posterior information calculations. |
Frequency Statistics
| Tool | Description |
|---|---|
| BINNED_STATISTIC | Computes a binned statistic (mean, sum, median, etc.) for the input data. |
| BINNED_STATISTIC_2D | Computes a bidimensional binned statistic (mean, sum, median, etc.) for the input data. |
| CUMFREQ | Compute the cumulative frequency histogram for the input data. |
| PERCENTILEOFSCORE | Computes the percentile rank of a score relative to the input data. |
| RELFREQ | Returns the relative frequency histogram for the input data. |
| SCOREATPERCENTILE | Calculates the score at the given percentile of the input data. |
Hypothesis Tests
Association Correlation
| Tool | Description |
|---|---|
| BARNARD_EXACT | Perform Barnard’s exact test on a 2x2 contingency table. |
| BOSCHLOO_EXACT | Perform Boschloo’s exact test on a 2x2 contingency table. |
| CHI2_CONTINGENCY | Perform the chi-square test of independence for variables in a contingency table. |
| FISHER_EXACT | Perform Fisher’s exact test on a 2x2 contingency table. |
| KENDALLTAU | Calculate Kendall’s tau, a correlation measure for ordinal data. |
| LINREGRESS | Calculate a linear least-squares regression for two sets of measurements. |
| MULTISCALE_GRAPH | Compute the Multiscale Graph Correlation (MGC) test statistic and p-value. |
| PAGE_TREND_TEST | Perform Page’s L trend test for monotonic trends across treatments. |
| PEARSONR | Calculate the Pearson correlation coefficient and p-value for two datasets. |
| POINTBISERIALR | Calculate a point biserial correlation coefficient and its p-value. |
| SIEGELSLOPES | Compute the Siegel repeated medians estimator for robust linear regression using scipy.stats.siegelslopes. |
| SOMERSD | Calculate Somers’ D, an asymmetric measure of ordinal association between two variables. |
| SPEARMANR | Calculate a Spearman rank-order correlation coefficient with associated p-value. |
| THEILSLOPES | Compute the Theil-Sen estimator for a set of points (robust linear regression). |
| WEIGHTEDTAU | Compute a weighted version of Kendall’s tau correlation coefficient. |
Independent Sample
| Tool | Description |
|---|---|
| ALEXANDERGOVERN | Performs the Alexander-Govern test for equality of means across multiple independent samples with possible heterogeneity of variance. |
| ANDERSON_KSAMP | Performs the k-sample Anderson-Darling test to determine if samples are drawn from the same population. |
| ANSARI | Performs the Ansari-Bradley test for equal scale parameters (non-parametric) using scipy.stats.ansari. |
| BARTLETT | Performs Bartlett’s test for equal variances across multiple samples. |
| BRUNNERMUNZEL | Computes the Brunner-Munzel nonparametric test for two independent samples. |
| BWS_TEST | Performs the Baumgartner-Weiss-Schindler test on two independent samples. |
| CVM_2SAMP | Performs the two-sample Cramér-von Mises test using scipy.stats.cramervonmises_2samp. |
| DUNNETT | Performs Dunnett’s test for multiple comparisons of means against a control group. |
| EPPS_SINGLE_2SAMP | Compute the Epps-Singleton test statistic and p-value for two samples. |
| F_ONEWAY | Performs a one-way ANOVA test for two or more independent samples. |
| FLIGNER | Performs the Fligner-Killeen test for equality of variances across multiple samples. |
| FRIEDMANCHISQUARE | Computes the Friedman test for repeated samples. |
| KRUSKAL | Computes the Kruskal-Wallis H-test for independent samples. |
| KS_2SAMP | Performs the two-sample Kolmogorov-Smirnov test for goodness of fit. |
| LEVENE | Performs the Levene test for equality of variances across multiple samples. |
| MANNWHITNEYU | Performs the Mann-Whitney U rank test on two independent samples using scipy.stats.mannwhitneyu. |
| MEDIAN_TEST | Performs Mood’s median test to determine if two or more independent samples come from populations with the same median. |
| MOOD | Perform Mood’s two-sample test for scale parameters. |
| POISSON_MEANS_TEST | Performs the Poisson means test (E-test) to compare the means of two Poisson distributions. |
| RANKSUMS | Computes the Wilcoxon rank-sum statistic and p-value for two independent samples. |
| TTEST_IND | Performs the independent two-sample t-test for the means of two groups. |
| TTEST_IND_STATS | Perform a t-test for means of two independent samples using summary statistics. |
One Sample
| Tool | Description |
|---|---|
| BINOMTEST | Perform a binomial test for the probability of success in a Bernoulli experiment. |
| JARQUE_BERA | Perform the Jarque-Bera goodness of fit test for normality. |
| KSTEST | Performs the one-sample Kolmogorov-Smirnov test for goodness of fit. |
| KURTOSISTEST | Test whether the kurtosis of a sample is different from that of a normal distribution. |
| NORMALTEST | Test whether a sample differs from a normal distribution (omnibus test). |
| QUANTILE_TEST | Perform a quantile test to determine if a population quantile equals a hypothesized value. |
| SHAPIRO | Perform the Shapiro-Wilk test for normality. |
| SKEWTEST | Test whether the skewness of a sample is different from that of a normal distribution. |
| TTEST_1SAMP | Perform a one-sample t-test for the mean of a group of scores. |
Models
Count
| Tool | Description |
|---|---|
| HURDLE_COUNT_MODEL | Fits a Hurdle model for count data with two-stage process (zero vs. |
| ZINB_MODEL | Fits a Zero-Inflated Negative Binomial (ZINB) model for overdispersed count data with excess zeros. |
| ZIP_MODEL | Fits a Zero-Inflated Poisson (ZIP) model for count data with excess zeros. |
Discrete Choice
| Tool | Description |
|---|---|
| LOGIT_MODEL | Fits a binary logistic regression model to predict binary outcomes using maximum likelihood estimation. |
| MULTINOMIAL_LOGIT | Fits a multinomial logistic regression model for multi-category outcomes. |
| ORDERED_LOGIT | Fits an ordered logistic regression model for ordinal outcomes. |
| PROBIT_MODEL | Fits a binary probit regression model using maximum likelihood estimation. |
Generalized Linear
| Tool | Description |
|---|---|
| GLM_BINOMIAL | Fits a Generalized Linear Model with binomial family for binary or proportion data. |
| GLM_GAMMA | Fit a Generalized Linear Model with Gamma family for positive continuous data. |
| GLM_INV_GAUSS | Fits a Generalized Linear Model with Inverse Gaussian family for right-skewed positive data. |
| GLM_NEG_BINOM | Fits a Generalized Linear Model with Negative Binomial family for overdispersed count data. |
| GLM_POISSON | Fits a Generalized Linear Model with Poisson family for count data. |
| GLM_TWEEDIE | Fits a Generalized Linear Model with Tweedie family for flexible distribution modeling. |
Mixed Effects
| Tool | Description |
|---|---|
| GEE_MODEL | Fits a Generalized Estimating Equations (GEE) model for correlated data. |
| GLMM_BINOMIAL | Fits a Generalized Linear Mixed Model (GLMM) with binomial family for binary clustered data. |
| GLMM_POISSON | Fits a Generalized Linear Mixed Model (GLMM) with Poisson family for count clustered data. |
| MIXED_LINEAR_MODEL | Fits a Linear Mixed Effects Model (LMM) with random intercepts and slopes. |
Regression
| Tool | Description |
|---|---|
| GLS_REGRESSION | Fits a Generalized Least Squares (GLS) regression model. |
| INFLUENCE_DIAG | Computes regression influence diagnostics for identifying influential observations. |
| OLS_DIAGNOSTICS | Performs diagnostic tests on OLS regression residuals. |
| OLS_REGRESSION | Fits an Ordinary Least Squares (OLS) regression model. |
| QUANTILE_REGRESSION | Fits a quantile regression model to estimate conditional quantiles of the response distribution. |
| REGRESS_DIAG | Performs comprehensive regression diagnostic tests. |
| ROBUST_LINEAR_MODEL | Fits a robust linear regression model using M-estimators. |
| SPECIFICATION_TESTS | Performs regression specification tests to detect model misspecification. |
| WLS_REGRESSION | Fits a Weighted Least Squares (WLS) regression model. |
Survival
| Tool | Description |
|---|---|
| COX_HAZARDS | Fits a Cox Proportional Hazards regression model for survival data. |
| EXP_SURVIVAL_REG | Fits a parametric exponential survival regression model. |
| KAPLAN_MEIER | Computes the Kaplan-Meier survival function estimate for time-to-event data. |
Multivariate Analysis
| Tool | Description |
|---|---|
| CANCORR | Performs Canonical Correlation Analysis (CCA) between two sets of variables. |
| FACTOR_ANALYSIS | Performs exploratory factor analysis with rotation. |
| MANOVA_TEST | Performs Multivariate Analysis of Variance (MANOVA) for multiple dependent variables. |
| PCA_ANALYSIS | Performs Principal Component Analysis (PCA) for dimensionality reduction. |
Probability Distributions
Continuous Distributions
| Tool | Description |
|---|---|
| BETA | Wrapper for scipy.stats.beta distribution providing multiple statistical methods. |
| CAUCHY | Wrapper for scipy.stats.cauchy distribution providing multiple statistical methods. |
| CHISQ | Compute various statistics and functions for the chi-squared distribution from scipy.stats.chi2. |
| EXPON | Exponential distribution function wrapping scipy.stats.expon. |
| F_DIST | Unified interface to the main methods of the F-distribution, including PDF, CDF, inverse CDF, survival function, and distribution statistics. |
| LAPLACE | Laplace distribution function supporting multiple methods. |
| LOGNORM | Compute lognormal distribution statistics and evaluations. |
| NORM | Normal (Gaussian) distribution function supporting multiple methods. |
| PARETO | Pareto distribution function supporting multiple methods. |
| T_DIST | Student’s t distribution function supporting multiple methods from scipy.stats.t. |
| UNIFORM | Uniform distribution function supporting multiple methods. |
| WEIBULL_MIN | Compute various functions of the Weibull minimum distribution using scipy.stats.weibull_min. |
Discrete Distributions
| Tool | Description |
|---|---|
| BERNOULLI | Calculates properties of a Bernoulli discrete random variable. |
| BETABINOM | Compute Beta-binomial distribution values from scipy.stats.betabinom. |
| BETANBINOM | Compute Beta-negative-binomial distribution values: PMF, CDF, SF, ICDF, ISF, mean, variance, std, or median. |
| BINOM | Compute Binomial distribution values: PMF, CDF, SF, ICDF, ISF, mean, variance, std, or median. |
| BOLTZMANN | Compute Boltzmann distribution values: PMF, CDF, SF, ICDF, ISF, mean, variance, std, or median. |
| DLAPLACE | Compute Discrete Laplace distribution values: PMF, CDF, SF, ICDF, ISF, mean, variance, std, or median. |
| GEOM | Compute Geometric distribution values using scipy.stats.geom. |
| HYPERGEOM | Compute Hypergeometric distribution values: PMF, CDF, SF, ICDF, ISF, mean, variance, std, or median. |
| LOGSER | Compute Log-Series distribution values: PMF, CDF, SF, ICDF, ISF, mean, variance, std, or median. |
| NBINOM | Compute Negative Binomial distribution values using scipy.stats.nbinom. |
| NHYPERGEOM | Compute Negative Hypergeometric distribution values using scipy.stats.nhypergeom. |
| PLANCK | Compute Planck distribution values using scipy.stats.planck. |
| POISSON_DIST | Compute Poisson distribution values using scipy.stats.poisson. |
| RANDINT | Compute Uniform discrete distribution values: PMF, CDF, SF, ICDF, ISF, mean, variance, std, or median. |
| SKELLAM | Compute Skellam distribution values using scipy.stats.skellam. |
| VAL_DISCRETE | Select a value from a list based on a discrete probability distribution. |
| YULESIMON | Compute Yule-Simon distribution values using scipy.stats.yulesimon. |
| ZIPF | Compute Zipf distribution values: PMF, CDF, SF, ICDF, ISF, mean, variance, std, or median. |
| ZIPFIAN | Compute Zipfian distribution values: PMF, CDF, SF, ICDF, ISF, mean, variance, std, or median. |
Multivariate Distributions
| Tool | Description |
|---|---|
| DIRICHLET | Computes the PDF, log-PDF, mean, variance, covariance, entropy, or draws random samples from a Dirichlet distribution. |
| DIRICHLET_MULTINOM | Computes the probability mass function, log probability mass function, mean, variance, or covariance of the Dirichlet multinomial distribution. |
| MATRIX_NORMAL | Computes the PDF, log-PDF, or draws random samples from a matrix normal distribution. |
| MULTINOMIAL | Compute the probability mass function, log-PMF, entropy, covariance, or draw random samples from a multinomial distribution. |
| MULTIVARIATE_NORMAL | Computes the PDF, CDF, log-PDF, log-CDF, entropy, or draws random samples from a multivariate normal distribution. |
| MULTIVARIATE_T | Computes the PDF, CDF, or draws random samples from a multivariate t-distribution. |
| MV_HYPERGEOM | Computes probability mass function, log-PMF, mean, variance, covariance, or draws random samples from a multivariate hypergeometric distribution. |
| ORTHO_GROUP | Draws random samples of orthogonal matrices from the O(N) Haar distribution using scipy.stats.ortho_group. |
| RANDOM_CORRELATION | Generates a random correlation matrix with specified eigenvalues. |
| SPECIAL_ORTHO_GROUP | Draws random samples from the special orthogonal group SO(N), returning orthogonal matrices with determinant +1. |
| UNIFORM_DIRECTION | Draws random unit vectors uniformly distributed on the surface of a hypersphere in the specified dimension. |
| UNITARY_GROUP | Generate a random unitary matrix of dimension N from the Haar distribution. |
| VONMISES_FISHER | Computes the PDF, log-PDF, entropy, or draws random samples from a von Mises-Fisher distribution on the unit hypersphere. |
| WISHART | Computes the PDF, log-PDF, or draws random samples from the Wishart distribution using scipy.stats.wishart. |
Summary Statistics
| Tool | Description |
|---|---|
| DESCRIBE | Compute descriptive statistics using scipy.stats.describe. |
| EXPECTILE | Calculates the expectile of a dataset using scipy.stats.expectile. |
| GMEAN | Compute the geometric mean of the input data, flattening the input and ignoring non-numeric values. |
| HMEAN | Calculates the harmonic mean of the input data, flattening the input and ignoring non-numeric values. |
| KURTOSIS | Compute the kurtosis (Fisher or Pearson) of a dataset. |
| MODE | Return the modal (most common) numeric value in the input data, returning the smallest if there are multiple modes. |
| MOMENT | Calculates the nth moment about the mean for a sample. |
| PMEAN | Computes the power mean (generalized mean) of the input data for a given power p. |
| SKEWNESS | Calculate the skewness of a dataset. |
Time Series
Autocorrelation And Stationarity Tests
| Tool | Description |
|---|---|
| ACF | Compute autocorrelation values across lags with optional confidence intervals and Ljung-Box statistics. |
| ACOVF | Estimate autocovariance values of a time series across lags. |
| ADFULLER | Run the Augmented Dickey-Fuller unit-root test for stationarity diagnostics. |
| CCF | Compute cross-correlation between two time series across nonnegative lags. |
| CCOVF | Estimate cross-covariance values between two time series across lags. |
| KPSS | Run the KPSS stationarity test under level or trend null hypotheses. |
| PACF | Compute partial autocorrelation values across lags for lag-order diagnostics. |
| Q_STAT | Compute Ljung-Box Q statistics and p-values from autocorrelation coefficients. |
| RURTEST | Run the range unit-root test as an alternative stationarity diagnostic. |
| ZIVOT_ANDREWS | Run the Zivot-Andrews unit-root test allowing one endogenous structural break. |
Decomposition And Seasonality
| Tool | Description |
|---|---|
| DETREND | Remove linear or constant trend from input data. |
| MSTL | Perform multi-seasonal STL decomposition on a time series. |
| PERIODOGRAM | Estimate the power spectral density of a time series using a periodogram. |
| SEASDECOMP | Decompose a time series into trend, seasonal, and residual components. |
| STL | Perform STL decomposition of a univariate time series. |
| WELCH | Estimate the power spectral density of a time series using Welch’s method. |
Forecasting Models
| Tool | Description |
|---|---|
| ARIMA_FORECAST | Fit an ARIMA model and return out-of-sample forecasts. |
| ARMA_ORDER_IC | Select ARMA order using an information criterion. |
| HANNAN_RISSANEN | Estimate ARMA parameters using the Hannan-Rissanen procedure. |
| HOLT_FORECAST | Fit Holt trend exponential smoothing and return forecasts. |
| HW_FORECAST | Fit Holt-Winters exponential smoothing and return forecasts. |
| INNOVATIONS_MLE | Estimate SARIMA parameters using innovations maximum likelihood. |
| SARIMAX_FORECAST | Fit a SARIMAX model and return out-of-sample forecasts. |
| SES_FORECAST | Fit simple exponential smoothing and return forecasts. |
Moving Averages
| Tool | Description |
|---|---|
| EMA_LFILTER | Compute an exponential moving average using recursive linear filtering. |
| EMA_PERIOD | Compute an exponential moving average using a period-derived smoothing constant. |
| SMA_CONV | Compute a simple moving average using discrete convolution with a uniform window. |
| SMA_CUMSUM | Compute a simple moving average using cumulative-sum differencing. |
| WINMA_CONV | Compute a weighted moving average by convolving data with a user-defined weight window. |
| WMA | Compute a rolling weighted moving average using user-supplied weights. |